Note
This is an old repo from when I was just learning Python.
You may still find it helpful, but I don't know if it works anymore.
If it doesn't, the main.py is pretty short, you can extract the useful bits from it
All you need is to run main.py, and it'll prompt you for your data .txt file, and export a .tsv.
Optionally, you can output as a .csv and/or scientific notation with the -c and -s flags switches respectively.
You will need Python 3 or above and a GNU/Linux or macOS computer. If you're using windows, I think it's only the os.system('clear') commands that are incompatible. You can just copy paste the rest as you need.
For freeware, LTspice is a great circuit analysis tool. However, its data export features are lacking. You can export the waveform data as a text by right-clicking the waveform as shown below.
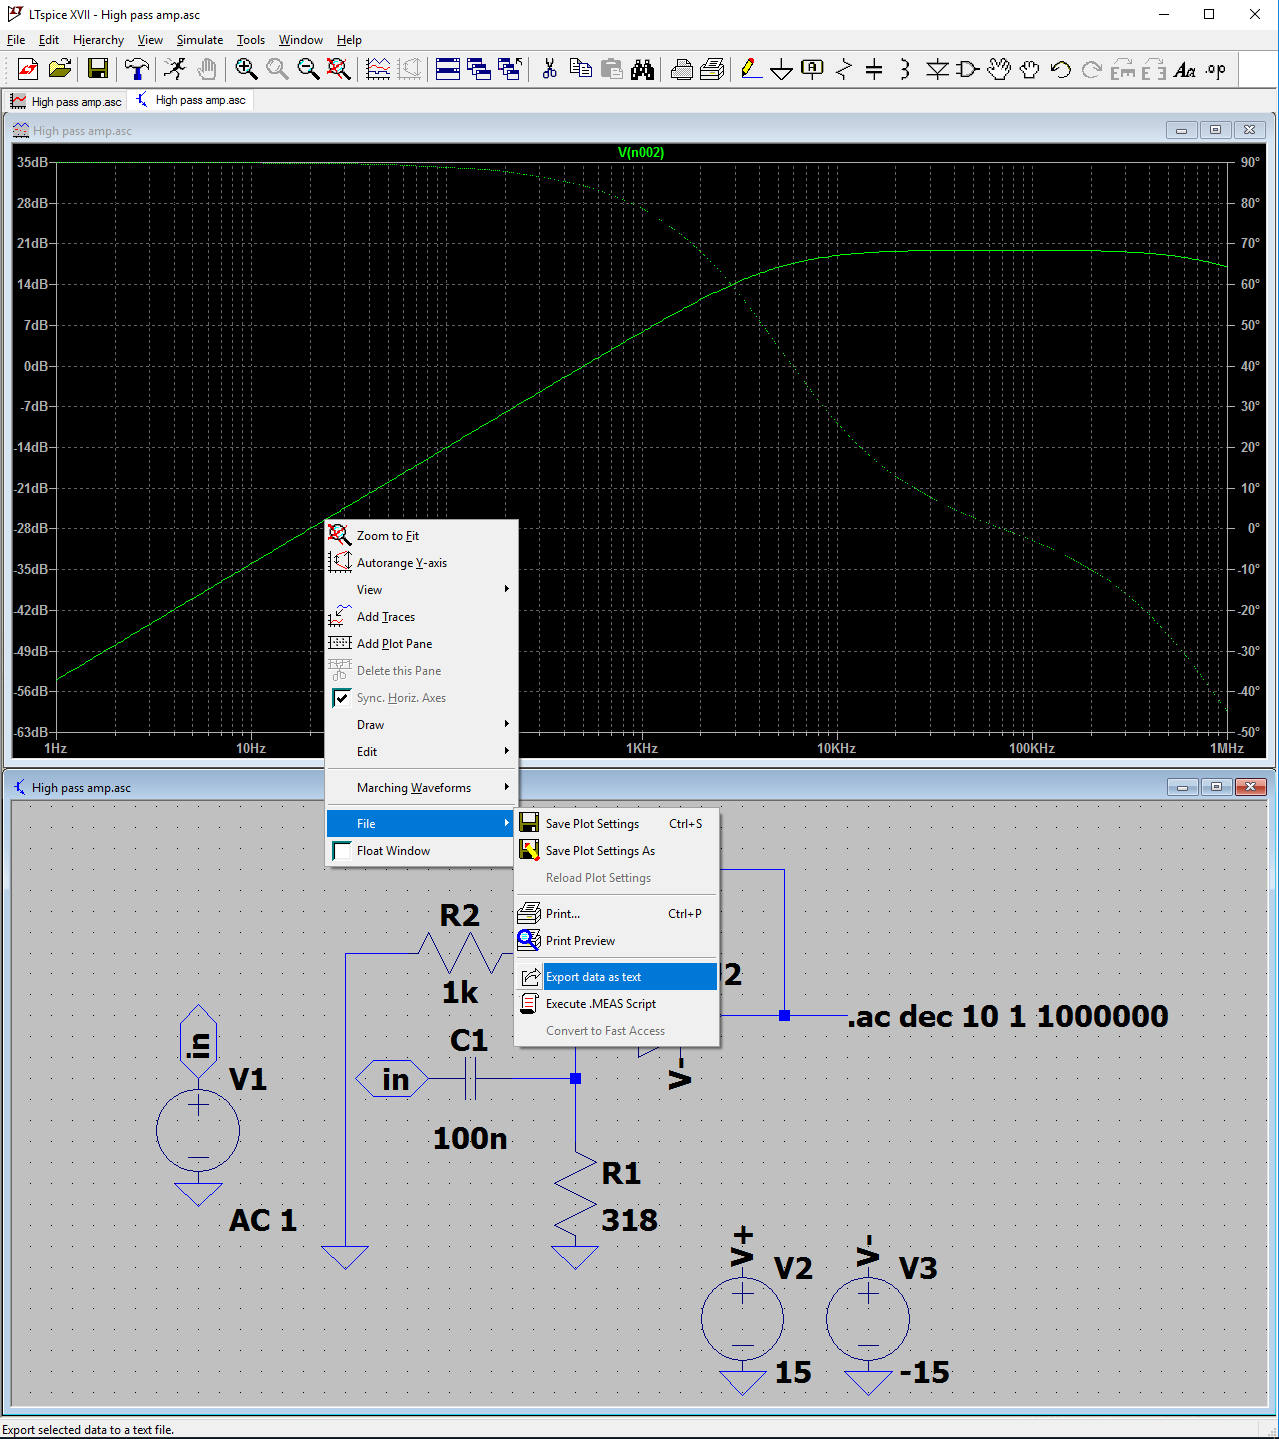
For typical AC analysis, this outputs a .txt file with inconvenient formatting for the voltage if you want to import the data to another program.
Freq.	V(n002)
1.00000000000000e+000	(-5.39879373612431e+001dB,8.99884945816811e+001�)
1.25892541179417e+000	(-5.19879374626541e+001dB,8.99855155366172e+001�)
This script converts that to a .tsv or .csv.
python main.pyLTspice Data Exporter by Arya Daroui
Drag and drop LTspice data .txt file to export to .tsv or just enter 'h' for help
file: data.txt
# data.tsv
Frequency (Hz)	Gain (dB)	Phase (°)
1.00000000000000	-53.9879373612431	89.9884945816811
1.25892541179417	-51.9879374626541	89.9855155366172
Now you can properly analyze the waveform or just make pretty charts for your documents.
