Rechart
Recharts는 React 및 D3으로 작성된 차트 라이브러리다.
이 라이브러리의 주요 목적은 고통 없이 리액션 애플리케이션에서 차트를 작성할 수 있도록 도와주는 것이다.
Rechart의 주요 원칙은 다음과 같다.
- React component로 쉽게 사용.
- Native SVG 지원, 일부 D3 submodules에 한해 경량화
- Declarative components이고, 차트의 component는 순수하게 presentational 하다.
단, 이 라이브러리 사용시 외부 라이브러리 d3-scale과 d3-scale-chromatic에 의존적이다.
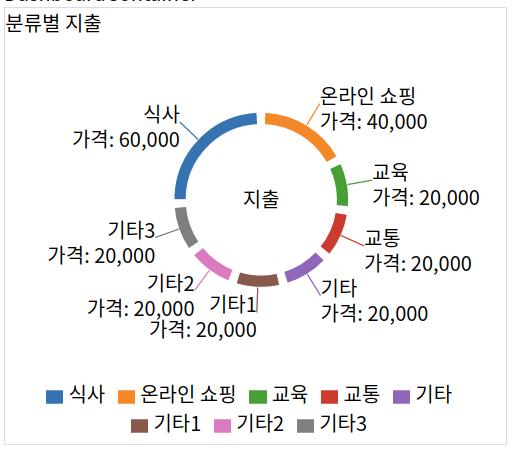
예)
<PieChart width={400} height={325}>
  <Legend paylodUniqBy />
  <Pie
    data={data}
    dataKey="value"
    cx={200}
    cy={125}
    startAngle={180}
    endAngle={-180}
    innerRadius={60}
    outerRadius={70}
    label={renderLabelContent}
    paddingAngle={5}
    isAnimationActive={true}
  >
    {data.map((entry, index) => (
      <Cell key={`slice-${index}`} fill={colors[index % 10]} />
    ))}
    <Label width={50} position="center">
      지출
    </Label>
  </Pie>
</PieChart>