Home
See the interactive SVG version.
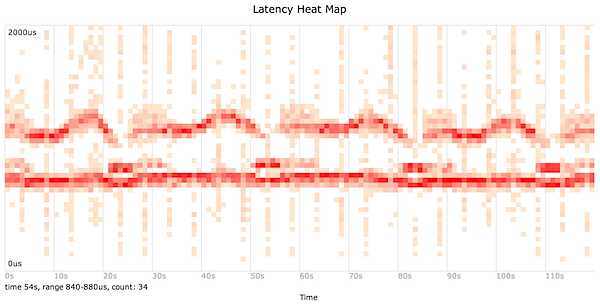
This visualizes event latency:
- x-axis: the passage of time, at a one second granularity
- y-axis: event latency
- z-axis (color saturation): how many events occurred at that time/latency range
This is similar to a scatter plot, but doesn't suffer from a density limit.
This example heat map shows disk I/O for two minutes, with latencies between 0 and 2000 us (2 ms). The distribution is bi-modal, and varies over time.