![]()
Plotext+ plots directly in your terminal with stunning visuals, modern APIs, and professional styling. Plotext+ is a redesigned version of the original plotext library by Savino Piccolomo. New features include an updated API with object oriented features, an MCP server to make the project easily usable with AI & LLM scenarios, new themes and integration with chuk-term to make sure it works in the awesome mcp-cli by Chris Hay.
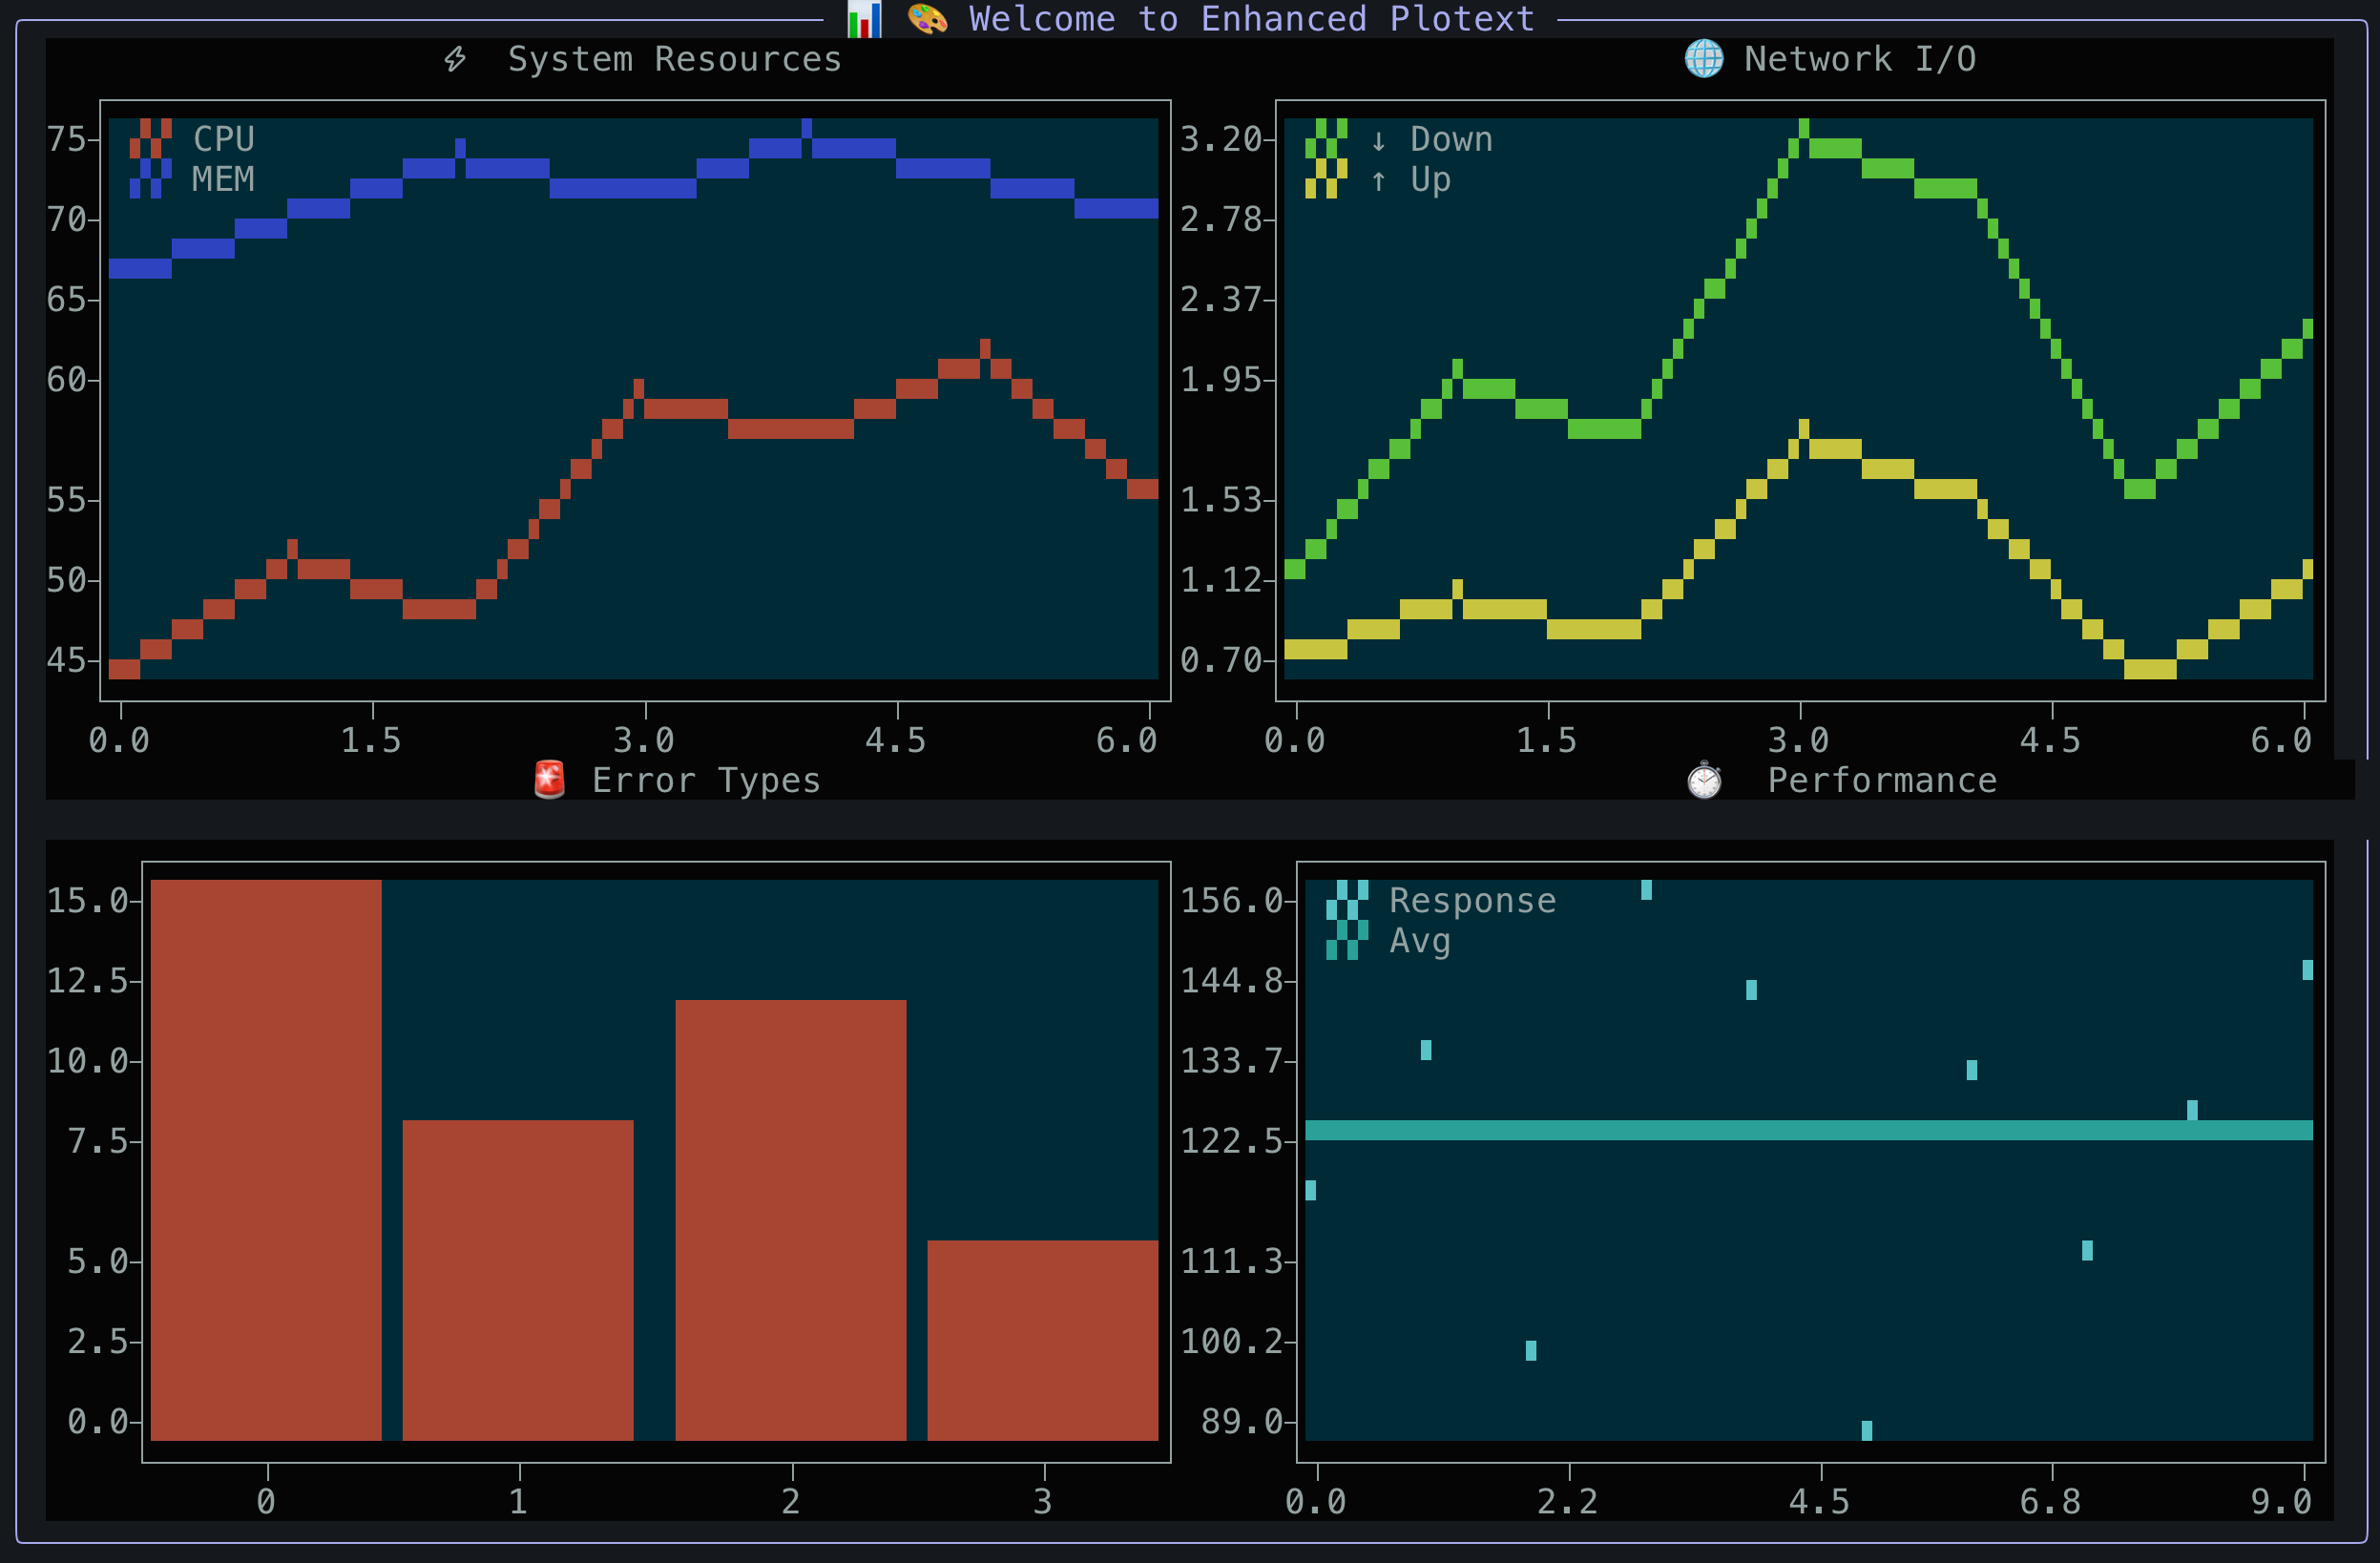
🎯 Multiple Plot Types: scatter, line, bar, histogram, candlestick, heatmap, confusion matrix, pie, doughnut and more
🎨 Rich Visuals: Banner mode, themes, colored text, automatic terminal width detection
📊 Advanced Features: Subplots, datetime plots, image/GIF display, video streaming (including YouTube)
🔧 Modern APIs: Clean public API, object-oriented charts, quick functions, 100% backward compatible
🤖 AI Integration: MCP server for direct AI client access (Claude, etc.)
⚡ Zero Dependencies: No required dependencies (optional packages for multimedia and AI integration)
# Modern Python package management
uv add plotext_plus

# Traditional installation
pip install plotext_plus

# With optional dependencies
pip install plotext_plus[image,video]      # Multimedia support
pip install plotext_plus[mcp]              # AI integration (MCP server)
pip install plotext_plus[image,video,mcp] # All featuresimport plotext_plus as plt
# Simple scatter plot
plt.scatter([1, 2, 3, 4], [1, 4, 9, 16])
plt.title("My First Plot")
plt.show()import plotext_plus as plt
# Enable beautiful banner mode
plt.banner_mode(True, "📊 Data Analysis Dashboard")
# Apply professional themes
plt.theme('professional')
# Create styled plot
plt.plot([1, 2, 3, 4], [1, 4, 2, 3], label="Data Series")
plt.title("Enhanced Line Plot")
plt.xlabel("Time")
plt.ylabel("Values")
plt.show()import plotext_plus as plt
# Object-oriented chart creation with method chaining
chart = (plt.ScatterChart([1, 2, 3, 4], [1, 4, 9, 16])
.title("Scientific Analysis")
.xlabel("X Variable")
.ylabel("Y Variable")
.color('blue')
.show())
# Quick one-liner plots
plt.quick_scatter(x_data, y_data, title="Quick Analysis")import plotext_plus as plt
# Access organized functionality
plt.plotting.bar(categories, values) # Main plotting functions
plt.themes.apply_theme('dark_mode') # Theme management
plt.utilities.log_success("Plot ready!") # Helper utilities# Install with MCP (Model Context Protocol) support
pip install plotext_plus[mcp]
# Start the MCP server for AI clients like Claude
plotext-mcpUse with Claude Desktop: Add to your claude_desktop_config.json:
{
  "mcpServers": {
    "plotext-plus": {
      "command": "plotext-mcp",
      "args": [],
      "env": {}
    }
  }
}
Now AI clients can create plots directly:
"Create a scatter plot showing x=[1,2,3,4,5] vs y=[1,4,9,16,25] with title 'Quadratic Function'"
# 🎯 Main Modules (Public API - no underscores)
plotext_plus.plotting    # Core plotting functions
plotext_plus.charts      # Object-oriented chart classes
plotext_plus.themes      # Theme and styling system
plotext_plus.utilities   # Helper functions and tools

# 📁 Internal Modules (Private - with underscores)
plotext_plus._core       # Internal implementation
plotext_plus._api        # Internal API details
plotext_plus._themes     # Theme internals
# ... other internal modulesplotext_plus/
├── src/plotext_plus/ # Modern src-layout
│ ├── plotting.py # 🎯 Main plotting functions (PUBLIC)
│ ├── charts.py # 🎯 Chart classes (PUBLIC)
│ ├── themes.py # 🎯 Theme system (PUBLIC)
│ ├── utilities.py # 🎯 Utilities (PUBLIC)
│ └── _*.py # 🔒 Internal modules (PRIVATE)
├── examples/ # Interactive demos
│ ├── interactive_demo.py # Full interactive showcase
│ └── theme_showcase_demo.py # Theme comparison tool
├── tests/ # Test suites
├── docs/ # Comprehensive documentation
└── pyproject.toml # Modern packaging- Professional Banners: Automatic width detection and border styling
- Advanced Theming: Multiple built-in themes with chuk-term integration
- Smart Layouts: Charts automatically resize to fit terminal dimensions
- Rich Colors: 24-bit color support with automatic fallbacks
- Clean API: Public modules clearly separated from internals
- Method Chaining: Fluent interface for complex plot creation
- Quick Functions: One-liner plots for rapid prototyping
- Type Safety: Better IDE support and autocomplete
- Zero Breaking Changes: 100% backward compatibility guaranteed
# Install and run interactive demo
pip install plotext_plus
python -c "
import plotext_plus as plt
plt.banner_mode(True, '🎨 Plotext Plus Demo')
plt.scatter([1,2,3,4], [1,4,2,3], color='blue')
plt.title('Welcome to Plotext Plus!')
plt.show()
"

# Run comprehensive demos
git clone https://github.com/ccmitchellusa/plotext_plus.git
cd plotext_plus
python examples/interactive_demo.py      # Full interactive showcase
python examples/theme_showcase_demo.py # Theme comparison- 📊 Basic Plots - Scatter, line, and fundamental plotting
- 📈 Bar Charts - Bar plots, histograms, and variations
- 📅 DateTime Plots - Time series and candlestick charts
- 🔬 Special Plots - Heatmaps, confusion matrices, error bars
- 🎨 Decorator Plots - Text, lines, and shape overlays
- 🖼️ Image Plotting - Display images and GIFs in terminal
- 🎬 Video Streaming - Play videos and YouTube content
- 📐 Subplots - Multiple plots and complex layouts
- 🎨 Themes - Built-in themes and customization
- ⚙️ Settings - Plot configuration and options
- 📏 Aspect - Size, scaling, and layout control
- 🔧 Chart Classes - Object-oriented API reference
- 🔧 Utilities - Helper functions and command-line tools
- 🤖 MCP Server - AI integration via Model Context Protocol
- 🌐 Environments - IDE and platform compatibility
- 🏗️ API Structure - Clean public API organization
- 📝 Notes - Installation, tips, and troubleshooting
- 👋 Introduction - First steps with Plotext
- 📦 Installation - Setup and dependencies
- 🎯 Quick Examples - Jump right in with code samples
- 🎨 Theming Guide - Make your plots beautiful
- 🔧 Modern API Guide - Use the clean public interface
For Existing Users: All your current code works unchanged! The new features are purely additive.
For New Users: Take advantage of the modern APIs and enhanced styling while learning the fundamentals.
# ✅ Your existing code still works
import plotext_plus as plt
plt.plot([1,2,3], [1,4,2])
plt.show()

# 🆕 Enhanced with new features
plt.banner_mode(True, "📊 My Analysis")
plt.theme('professional')
plt.plot([1,2,3], [1,4,2])
plt.show()Plotext+ includes a comprehensive build system with modern tooling. See Build Documentation for complete setup, testing, publishing, and deployment instructions.