Clinical ML Pipeline Toolkit — production-grade data loading, preprocessing, and time-series feature engineering for healthcare AI research.

![]()
Docs: https://clinops.readthedocs.io/ | PyPI: https://pypi.org/project/clinops/
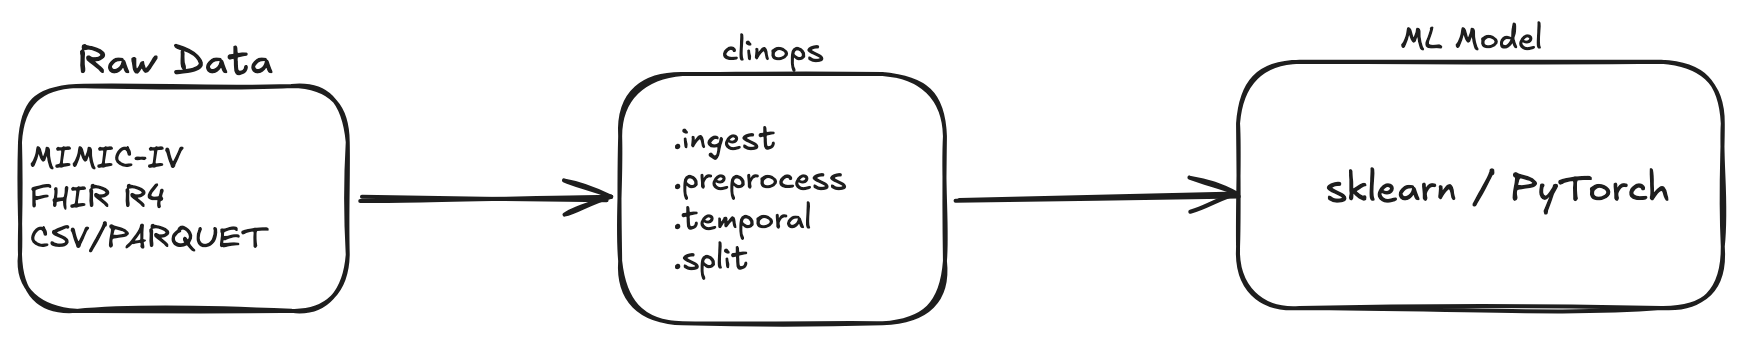
Every healthcare AI project starts with the same two weeks of plumbing: loading
MIMIC-IV tables without hitting memory limits, clipping physiologically impossible
values before they corrupt your model, normalizing glucose from mmol/L to mg/dL
across sites, building time-series windows that handle clinical missingness correctly,
and splitting data without leaking patients across folds. clinops packages those
hard-won patterns into a single, well-tested library so your first notebook is actual
science.
Built from production experience in clinical and genomic data engineering across multi-cloud environments.
| Module | What it does |
|---|---|
clinops.ingest |
Loaders for MIMIC-IV, FHIR R4, and flat CSV/Parquet with schema validation. Includes MimicTableLoader with pre-built schemas for the five tables researchers always need. |
clinops.temporal |
Sliding/tumbling windows, gap-aware imputation, lag features, cohort alignment |
clinops.preprocess |
Outlier clipping with physiological bounds, unit normalization (mg/dL ↔ mmol/L etc.), ICD-9→10 mapping |
clinops.split |
Temporal, patient-level, and stratified patient train/test splitting |
Roadmap: clinops.monitor (drift detection, data quality) and clinops.orchestrate
(GCS/S3, Step Functions) are planned for v0.2.
pip install clinopsMimicTableLoader wraps MimicLoader and exposes the five MIMIC-IV tables
researchers use in every project with fully validated schemas out of the box.
No ColumnSpec definitions, no schema boilerplate.
from clinops.ingest import MimicTableLoader

tbl = MimicTableLoader("/data/mimic-iv-2.2")

# ICU vitals — charttime parsed as datetime automatically
charts = tbl.chartevents(subject_ids=[10000032, 10000980])

# Lab results — reference range columns dropped by default (sparse in most exports)
labs = tbl.labevents(subject_ids=[10000032], with_ref_range=True)

# Hospital admissions with mortality flag
adm = tbl.admissions(subject_ids=[10000032])

# ICD-9/10 diagnoses — primary_only keeps only seq_num == 1
dx = tbl.diagnoses_icd(subject_ids=[10000032], primary_only=True)

# ICU stays — with_los_band adds <1d / 1-3d / 3-7d / >7d column
stays = tbl.icustays(subject_ids=[10000032], with_los_band=True)
Audit a new MIMIC download without loading full tables into memory:
tbl.summary()
#        table  rows_sampled  columns  null_rate_pct
#  chartevents         10000       23           8.41
#    labevents         10000       12           4.17
#   admissions         10000       15           6.02
# diagnoses_icd        10000        5           0.00
# icustays 10000 8 2.31For advanced filtering and chunk-based loading of large tables, use MimicLoader
directly:
from clinops.ingest import MimicLoader

loader = MimicLoader("/data/mimic-iv-2.2")

charts = loader.chartevents(
    subject_ids=[10000032, 10000980],
    start_time="2150-01-01",
    end_time="2150-01-10",
)
labs  = loader.labevents(subject_ids=[10000032, 10000980])
stays = loader.icustays(subject_ids=[10000032, 10000980])from clinops.ingest import FHIRLoader
loader = FHIRLoader("/data/fhir_export")
obs = loader.observations(category="vital-signs")
patients = loader.patients()from clinops.ingest import FlatFileLoader, ClinicalSchema, ColumnSpec
schema = ClinicalSchema(
name="vitals",
columns=[
ColumnSpec("subject_id", nullable=False),
ColumnSpec("heart_rate", min_value=0, max_value=300),
ColumnSpec("spo2", min_value=50, max_value=100),
]
)
df = FlatFileLoader("vitals.csv", schema=schema).load()Standard statistical outlier methods (z-score, IQR) are wrong for clinical data —
a heart rate of 180 in a patient with SVT is clinically meaningful and should not
be removed. ClinicalOutlierClipper uses published physiological bounds to remove
values that are impossible regardless of patient state.
from clinops.preprocess import ClinicalOutlierClipper

clipper = ClinicalOutlierClipper(action="clip")  # or "null" or "flag"
clean_df = clipper.fit_transform(vitals_df)

print(clipper.report())
#    column  low_outliers  high_outliers  pct_outliers  bound_low  bound_high
#  heart_rate             0              3         0.012          0         300
#        spo2             1              0         0.004         50         100
Built-in bounds cover 20 vitals and labs (heart_rate, spo2, sbp, glucose,
creatinine, ph, wbc, and more). Add site-specific ranges with add_bounds().
Multi-site studies routinely mix mg/dL and mmol/L for the same lab, or °F and °C
for temperature. UnitNormalizer detects non-standard units via a companion unit
column and converts in-place.
from clinops.preprocess import UnitNormalizer

# df has a "glucose" column and a "glucose_unit" column (mixed "mg/dL" / "mmol/L")
normalizer = UnitNormalizer(column_unit_map={"glucose": "glucose_unit"})
df = normalizer.transform(df)
# All glucose values now in mg/dL; glucose_unit column updated

print(normalizer.report())
#   column from_unit to_unit  n_converted
#  glucose    mmol/L   mg/dL          142
30 registered conversions covering glucose, creatinine, bilirubin, haemoglobin, calcium, temperature, weight, and height.
MIMIC-III uses ICD-9, MIMIC-IV mixes both versions, and many real-world datasets
span the October 2015 transition. ICDMapper converts ICD-9-CM codes to ICD-10-CM
and adds chapter-level groupings for ML features.
from clinops.preprocess import ICDMapper

mapper = ICDMapper()

# Map a mixed-version DataFrame to ICD-10 in-place
df = mapper.harmonize(df, code_col="icd_code", version_col="icd_version")

# Add chapter-level grouping (e.g. "Diseases of the circulatory system")
df["chapter"] = mapper.chapter_series(df["icd_code"])

# Map a single code
mapper.map_code("4280")   # → "I509"
Ships with ~60 curated high-frequency mappings. Load the full CMS GEM file
(~72,000 mappings) with ICDMapper.from_gem_file(path).
from clinops.temporal import TemporalWindower, ImputationStrategy

windower = TemporalWindower(
    window_hours=24,
    step_hours=6,
    imputation=ImputationStrategy.FORWARD_FILL,
    min_observations=3,
)

windows = windower.fit_transform(
    df=charts,
    id_col="subject_id",
    time_col="charttime",
    feature_cols=["heart_rate", "spo2", "resp_rate", "map"],
)
# → DataFrame: subject_id | window_start | window_end | heart_rate | spo2 | ...windows = windower.fit_transform(
df=charts,
id_col="subject_id",
time_col="charttime",
item_col="itemid", # auto-pivots to wide format
value_col="valuenum",
)from clinops.temporal import LagFeatureBuilder
enriched = LagFeatureBuilder(
lags=[1, 2, 4],
rolling_windows=[4, 8],
id_col="subject_id",
).fit_transform(windows)
# Adds: heart_rate_lag1, heart_rate_roll4_mean, heart_rate_roll4_std, ...from clinops.temporal import CohortAligner
aligned = CohortAligner(
anchor_col="intime",
max_hours_before=0,
max_hours_after=48,
).align(events_df=charts, anchor_df=stays)
# → filtered to 48h post-admission, with hours_from_anchor columnClinical data has unique missingness patterns that standard ML windowing gets wrong.
clinops provides strategies tuned for clinical context:
| Strategy | Best for |
|---|---|
FORWARD_FILL |
Slowly-changing vitals — carry last observation forward |
BACKWARD_FILL |
Values recorded with lag |
LINEAR |
Continuous signals with regular sampling |
MEAN / MEDIAN |
Fit on training set, apply to test (no leakage) |
INDICATOR |
Adds {col}_missing binary column — lets model learn from missingness |
NONE |
Leave NaN in place |
from clinops.temporal import Imputer, ImputationStrategy

imputer = Imputer(ImputationStrategy.MEAN, per_patient=True, id_col="subject_id")
imputer.fit(train_windows)
test_windows = imputer.transform(test_windows)Standard sklearn.train_test_split is wrong for clinical ML: it leaks future
observations into training, and splits patients across folds so the model
memorises patient-specific patterns rather than generalising.
from clinops.split import TemporalSplitter

result = TemporalSplitter(cutoff="2155-01-01", time_col="charttime").split(df)
# or auto-compute cutoff from the data:
result = TemporalSplitter(train_frac=0.8, time_col="charttime").split(df)

print(result.summary())
# Train: 38,400 rows (80.0%)
# Test:   9,600 rows (20.0%)
# cutoff: 2155-01-01 00:00:00from clinops.split import PatientSplitter
result = PatientSplitter(id_col="subject_id", test_size=0.2).split(df)
# Guaranteed: no patient appears in both splits
assert not set(result.train["subject_id"]) & set(result.test["subject_id"])Critical for imbalanced clinical endpoints (in-hospital mortality is typically 5–15%). Stratifies on a binary outcome while respecting patient boundaries.
from clinops.split import StratifiedPatientSplitter

result = StratifiedPatientSplitter(
    id_col="subject_id",
    outcome_col="hospital_expire_flag",
    test_size=0.2,
).split(df)

print(result.summary())
# Train: 32,000 rows (80.0%)
# Test:   8,000 rows (20.0%)
# population_outcome_rate: 0.0821
# train_outcome_rate:      0.0819
# test_outcome_rate: 0.0826Requires Python 3.12+.
pip install clinops           # core
pip install clinops[fhir]     # adds FHIR R4 loader
pip install clinops[gcp]      # adds GCP extras (for v0.2)
pip install -e ".[dev]" # development| Source | Format |
|---|---|
| MIMIC-IV v2.0–v2.2 | CSV, CSV.GZ, Parquet |
| FHIR R4 | JSON Bundle, NDJSON |
| Flat files | CSV, CSV.GZ, Parquet |
This library was developed with assistance from Claude (Anthropic) as an AI pair-programming tool. Specifically, Claude was used for:
- Generating test cases — unit test drafts for edge cases (e.g., empty DataFrames, single-patient cohorts, missing unit columns), all reviewed and validated against real expected outputs
- Drafting docstrings — inline documentation for public methods, reviewed and corrected for accuracy by the author
- Iterating on error messages — improving the clarity of
ValueErrorandlogger.warningmessages
See CONTRIBUTING.md. Run pytest tests/ -v and
ruff check clinops/ before opening a PR.
@software{kasaraneni2026clinops,
  author  = {Kasaraneni, Chaitanya},
  title   = {clinops: Clinical ML Pipeline Toolkit},
  year    = {2026},
  url     = {https://github.com/chaitanyakasaraneni/clinops},
  version = {0.1.7}
}
A companion JOSS paper is in preparation.
Apache 2.0 — see LICENSE.