minabides is a small, focused financial market simulation, inspired by ABIDES but built from scratch. It is focused on multi-agent interaction at a simulated exchange which is also receiving historical replay of a complete Nasdaq order stream.
minabides is intended as a powerful but straightforward jumping off point for experimentation with deep reinforcement learning in an interactive historical financial market simulation. It should be robust enough for peer-reviewed research but simple enough for use in an AI, ML, or computational finance course.
Examples of the plots and tables minabides can produce are at the bottom of the page.
Particularly when contrasted to ABIDES, minabides has several distinct features:
- Full Nasdaq order replay to the simulated exchange
- Cache and fast-forward history to a designated start time, dramatically speeding up repeat experiments
- Simulation automatically delays all agents according to their actual computational "thinking" time
- Working continuous RL agent included, based on cleanrl
- Very easy to create new experimental configurations
- e.g. experiments/background.py is only about ten lines of code ignoring imports and comments
- Useful descriptive statistics and plots are built in, pulling from automated logs (also built in)
- Support for large parallel experiments on a slurm high performance computing cluster
- For learning experiments, training, validation, and out of sample testing are conducted automatically
It maintains some key features from ABIDES as well:
- Agents follow a (relatively) realistic model for latency and jitter in all their communications
- Agents may receive noisy observations of a fundamental time series disconnected from the simulated exchange
- Discrete event kernel for efficient simulation of sparse but high-resolution actions (e.g. HFT)
- Several types of common background agents are included
Create a virtual environment and install the required packages.
python3.12 -mvenv venv
source venv/bin/activate
pip install -r requirements.txtOpen a command shell to the base minabides directory, activate your virtual environment, then:
python run_exp.py --exp backgroundThis runs a single simulation using all available background agents. Alternatively:
python run_exp --exp rlThis runs a single simulation using a deep reinforcement learning agent with continuous environment and actions. This experiment has many configurable parameters to select the type of RL agent, configure its hyperparameters, and optionally add background agents alongside it.
These are important to consider when first launching an experiment:
- run_exp.py The main program to launch any minabides simulation.
- experiments/ The folder that holds experiment files passed to the --exp parameter of run_exp.py.
- simulation.py The core simulation logic initiated by an experiment after agent configuration.
Additional base simulation components:
- history.py Contains the logic to replay, cache, and fast-forward historical order stream data.
- market/ Holds all of the background market agents: exchange, market maker, momentum, noise, order book imbalance, and value, and their base classes.
- rl/ Holds the reinforcement learning trading agents: DDPG, DQN, and TD3.
- util.py Contains utility methods used by other logic.
After running a simulation, you may want:
- collect_logs.py Pulls together the logs from a whole batch of experiments to a single CSV for further analysis.
- stats.py Pulls together the logs from a whole batch of experiments, then produces descriptive statistics and plots.
The other folders are:
- analysis/ Where stats.py places its output.
- data/ Where history.py expects historical data to be.
- results/ Holds the results of all experiments in subdirectories named for the experiment or batch.
- results/.slurm/ Holds output and error files when running batch experiments under slurm cluster management.
- results/[experiment]/book Holds the orderbook and transaction logs for a set of experiments.
- results/[experiment]/loss Holds the RL agent training loss logs for a set of experiments.
- results/[experiment]/out Holds a copy of the raw stdout for a set of experiments.
- results/[experiment]/perf Holds the financial performance logs for a set of experiments.
If you have access to a slurm cluster, you may also like:
- hp_search.sh A slurm file for use with sbatch to launch hundreds of hyperparameter search experiments in parallel.
minabides does not currently come with data due to licensing constraints. It has the ability, out of the box to work with level zero message files from LOBSTER (https://lobsterdata.com), which is processed from Nasdaq TotalView data and licensed for academic use. Simply place message files in the ./data/lobster folder.
Note that premarket data is expected starting from midnight, so the history module can ensure the correct opening limit order book is reconstructed in the exchange.
The minabides project, including its code, comments, and documentation, was produced entirely without the use of any LLM, Copilot, advanced auto-completion, or other Generative AI. (It was written in vi on a server running Rocky Linux.)
minabides provides builtin descriptive statistics and plots. Below are some examples.
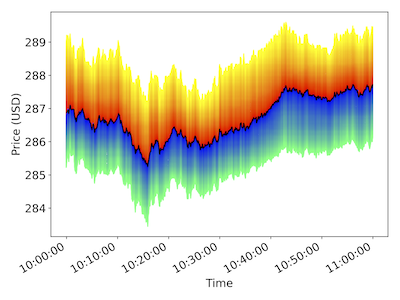
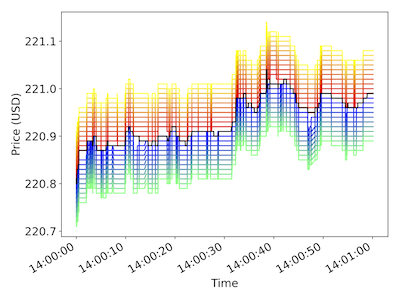
Left: Visualization of depth 100 order book at one second interval over one hour. Right: Depth 10 at one millisecond interval over one minute. Cool colors are bids, warm colors are asks, and the black line is the last transaction price at each time.
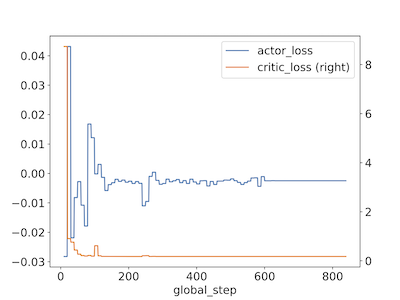
Plot showing the actor and critic loss convergence for a TD3-based trading agent.
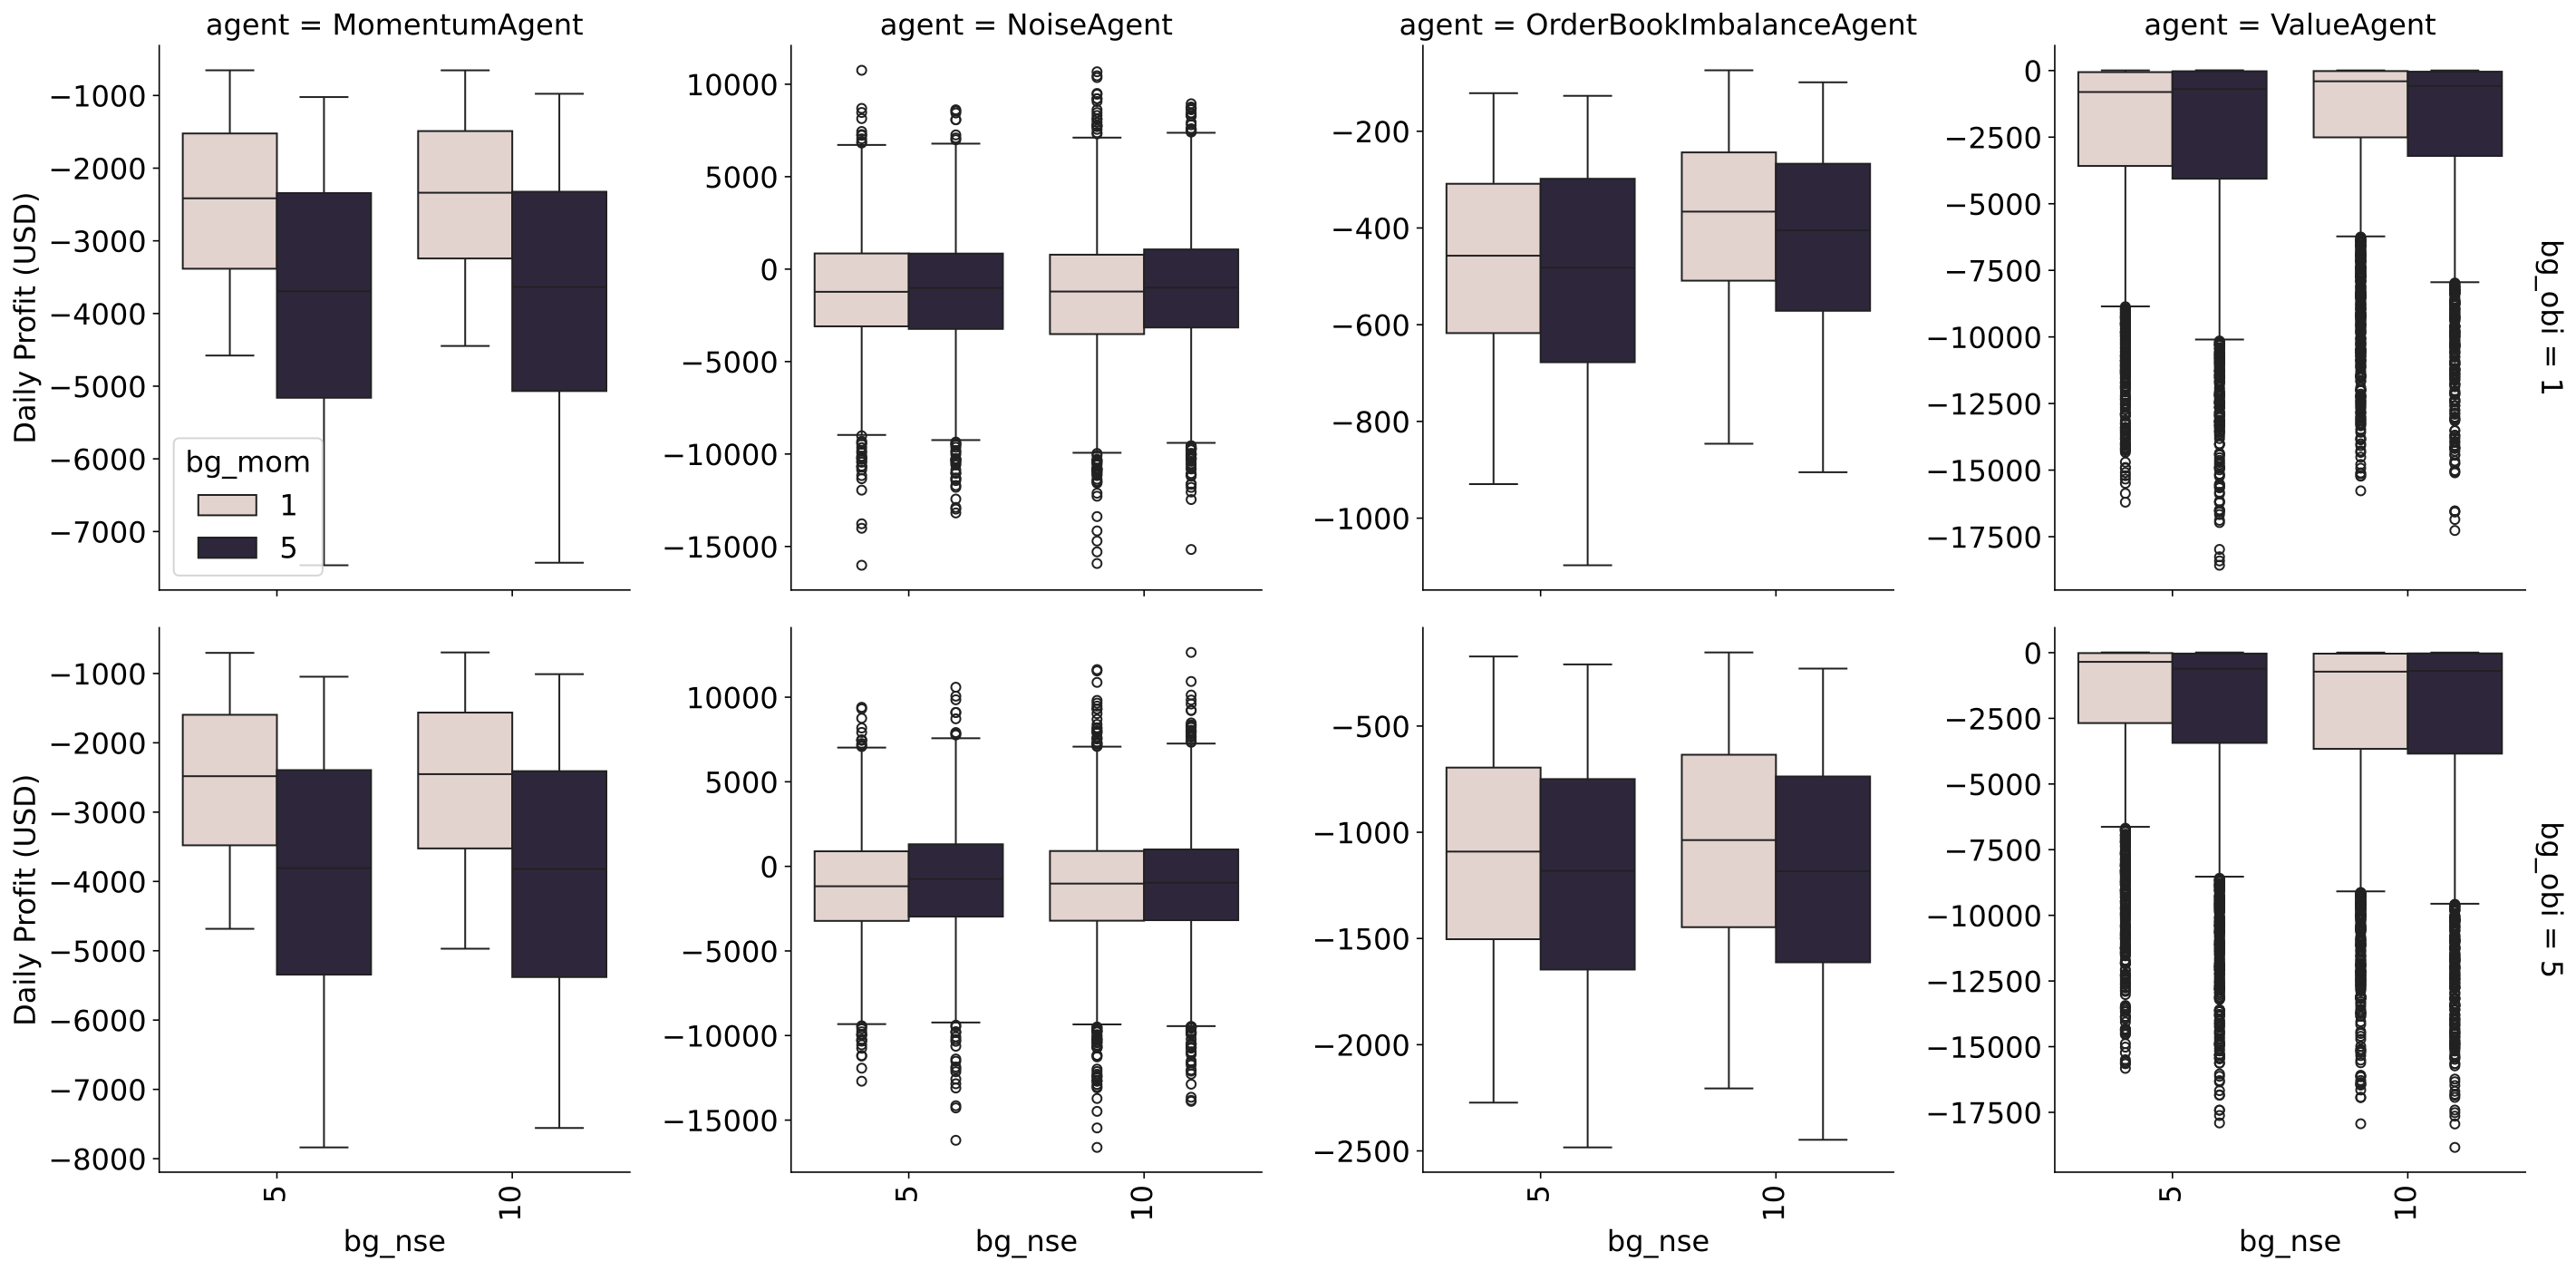
The included stats.py program allows parameters for breaking out performance results in many ways. This plot shows the daily profit distribution by agent type (row), and the number of order book imbalance agents (row), number of momentum agents (color), and number of noise agents (x-axis of each subplot).
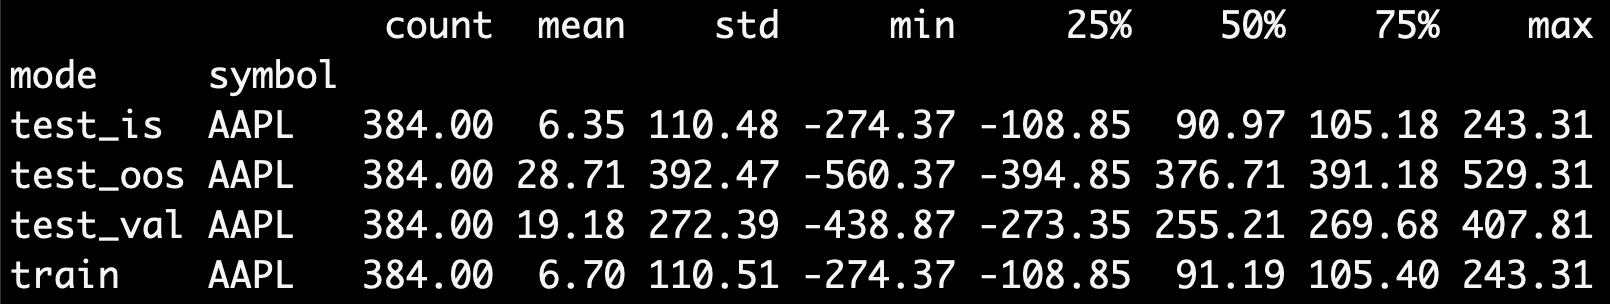
minabides also automatically generates descriptive statistics for an experiment, or a large batch of experiments. Parameters allow grouping by any one or more logged hyperparameters, for example: action interval, agent type, learning rate, or training mode.