Visual Cards is javascript library that can be used in single page web applications. It is written to replace document object model (DOM). Any application that is developed using visual-cards, can be drawn by different backends (DOM, Canvas or WebGL) by passing a single parameter.
Main motivation is to find a way to increase performance of web applications for embedded devices such as Smart TVs, set-top-boxes (STB) or smart phones. This project was inspired by project Gibbon from Netflix which is not open-source. Some information can be found on the internet. If you want to learn more about project Gibbon, you can watch the video linked below.
https://www.youtube.com/watch?v=eNC0mRYGWgc
Usually TV user-interface (10 foot user interface https://en.wikipedia.org/wiki/10-foot_user_interface ) consists of big images and less text. Targeted design aspect ratio is mostly constant (eg. 16:9). It is also easier to position elements as relative to their parents. In order to use visual-cards, application should not need a flow based positioning as CSS allows.
See examples at the link below and switch between renderer backends (DOM, Canvas and WebGL)
https://ercang.github.io/visual-cards/
In order to checkout & run, git client, nodejs and npm must be installed on your system.
git clone https://github.com/ercang/visual-cards.git

cd visual-cards/

npm install

cd src/server/

node CommunicationServer.js
CommunicationServer script is used as a small HTTP server for development. Also it starts a socketio server to enable visual-card applications to mirrored to different devices. This can be used for debugging devices which will be explained later. After running this script, there must be a line as “CommunicationServer is running on: http://localhost:8080”. After seeing this line, point your browser to http://localhost:8080.
You can examine the example1 to see how it works.
In HTML file, visual-cards needs a div to attach canvas element into it.
Example1.html
<div id="rendererContainer"></div>Visual-cards uses RequireJS. Script file must be included similar to this. Paths are given as if the files in “examples” folder.
<script data-main="example1" src="../third_party/require.js"></script>When require.js is included it loads “example1.js” and runs that script.
Following code, creates visual-cards instance and initializes it.
var container = document.getElementById('rendererContainer');
this.visualCards = new VisualCards({
   'container': container,
   'width': 900,
   'height': 600,
   'renderer': 'webgl'});
this.visualCards.init();
Background color of the root node can be changed like this.
var root = this.visualCards.getRootNode();
root.setProp({'backgroundColor': '#999999'});
This ‘root’ is the start of the virtual DOM and it is a (virtual) node object.
Another node can be added like this.
var titleNode = this.visualCards.createNode();
titleNode.setProp({'text': 'My Title',
   'top': 20,
   'left': 250,
   'width': 500,
   'height': 50,
   'color': '#000000',
   'fontSize': 48,
   'fontFamily': 'sans-serif'
});
root.appendChild(titleNode);
All positions are relative to its parent node. Also it is possible to add a child to “titleNode”. Any child of “titleNode” will start at “top”:20 and “left”: 250.
All animations are managed by AnimationRunner object. This basically sets node properties in constant intervals.
this.visualCards.animate({node: titleNode,
   from: {width: 500,
       height: 50,
       top: 20,
       left: 250,
       opacity: 0},
   to: {width: 600,
       height: 75,
       top: 50,
       left: 300,
       opacity: 1},
   easing: 'easeOutCubic',
   loop: true,
   loopReverse: true,
   duration: 1000});
This “animate” functions is similar to jQuery’s animate. It basically interpolates between “from” parameters to “to” parameters in “duration” milliseconds. If “loop” is set to true, animation will run forever. If “loopReverse” is set to true, when animation is finished it will revert back to starting values. “easing” is the function name for interpolation function.
“easing” can be “linear”, “easeInQuad”, “easeOutQuad”, “easeInOutQuad”, “easeInCubic”, “easeOutCubic”, “easeInOutCubic”. Other functions can be added to src/core/Easing.js if needed.
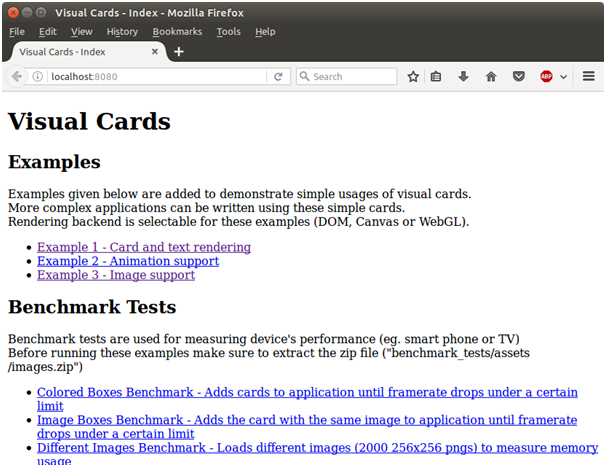
After running CommunicationServer script, navigate to http://localhost:8080. You will see the home page that contains links to the examples. Or you can visit the demo page.
https://ercang.github.io/visual-cards/
A sample to demonstrate text and background rendering.
https://ercang.github.io/visual-cards/examples/example1.html?canvas
A sample to demonstrate animation support.
https://ercang.github.io/visual-cards/examples/example2.html?canvas
A sample to demonstrate image support. Only dirty rectangles are rendered when canvas implementation is used.
https://ercang.github.io/visual-cards/examples/example3.html?canvas
Benchmark tests are used for measuring device's performance (eg. smartphone or TV). These tests are run on different platforms to measure performance of rendering backends.
There is only one type of “Node” that can be added to the virtual DOM. This ‘node’ has similar properties to standard DOM element.
| Property Name | Default - (Other Values) | Description |
|---|---|---|
| text | “” | Text content of the node |
| textType | “Dynamic” - (“static”) | This option only changes the behavior of WebGL renderer. Static text uses an offscreen texture to store text data. Dynamic text uses bitmap fonts. |
| whiteSpace | “Normal” - (“nowrap”) | Text will be wrapped into card. If nowrap is specified then text will be clipped. |
| top | 0 | Top offset value in pixel units. This value is relative to its parent |
| left | 0 | Left offset value in pixel units. This value is relative to its parent |
| width | 0 | Width of the node in pixel units. |
| height | 0 | Height of the node in pixel unit. |
| backgroundImage | undefined | Background image path as string |
| fitBackgroundImage | false | If set to true, background image will be scaled to fit the node. Otherwise background image can be clipped. |
| backgroundColor | undefined | Background color of the node. |
| visibility | “Visible” - (“hidden”) | Visibility of the node. If it is set to hidden, renderer will ignore this node. |
| borderOpacity | 1 | Opacity of the borders. Value can be between 0.0 and 1.0. |
| borderWidth | 0 | Border width in pixel unit. |
| borderColor | undefined | Border color string |
| opacity | 1 | Opacity of the node. Value can be between 0.0 and 1.0 |
| color | “#000000” | Color of the text |
| fontFamily | “sans-serif” | Font of the text. If font is not found then the default will be used. |
| fontSize | 24 | Size in pixel units of the font |
| fontWeight | “normal” - (“bold”) | Defines the font weight. |
| rotation | 0 | Node’s rotation in radian. This can be between 0 and 2*PI |
| showOnTop | false | If this property is set to true, that node will be drawn last. |
init()
animate(options)
finalizeAnimation(node)
cancelAnimation(node)
getRootNode()
createNode()
getDocumentContainer()
getId()
getRoot()
getParent()
setProp(properties)
getProp(propertyName)
getChildren()
appendChild()
removeChild(node)
removeChildren()
findById(id)
Projects listed here for reference purposes.
http://fmtvp.github.io/tal/getting-started/introducing-tal.html
BBC T.A.L (Tv Application Layer) is a framework for simplifying TV application development. BBC apps (iPlayer, red button etc.) uses this framework according to its website. BBC T.A.L. is a widget based framework. This and visual-cards do not have much in common, as visual-cards is only focused on graphics and rendering.
In order to develop an application with visual-cards, developer must organize application code. BBC T.A.L provides a way to develop an application. Also it has many utility classes.
https://www.youtube.com/watch?v=eNC0mRYGWgc
Netflix Gibbon is not open source, the information here is gathered from web and it can be changed. According to their talk Gibbon uses virtual DOM to keep track of UI elements and hierarchy. Instead of using DOM directly, rendering is done on a canvas element. According to their claim, it is faster than using DOM directly.
Visual-cards is inspired by Gibbon, so they have a similarity as both uses JSON virtual DOM to store data. In order to ease the development, Gibbon uses React (may be a modified version of it) for application development but in visual-cards developer must organize its code by him/herself.
http://engineering.flipboard.com/2015/02/mobile-web/
Another similar project is Flipboard’s ReactCanvas. This one is similar to Netflix Gibbon. It uses ReactJS, but rendering is done on a canvas element. Their motivation is to reach 60fps on mobile browsers.
Text rendering depends on the renderer backend. If DOM is selected as backend, then text rendering will be done by simply setting the innerHTML property of an element.
If canvas is selected as backend, then text rendering will be done by drawing text into an offscreen canvas element. This offscreen canvas element is associated with the node. If node needs to be draw again, dirty region is calculated and copied from offscreen canvas to main canvas element. This approach is faster as fillText() is not called again but using an offscreen buffer for every text element requires high memory. This may be a problem on embedded devices. In this method partial updates are easier to implement.
WebGL has two methods for text rendering. If textType is “static”, then rendering will be done similar to the canvas version. Whenever a text is updated, text is renderer to an offscreen canvas element. Then a texture is generated from this offscreen canvas element. When a node needs to be updated, this texture is drawn to display text.
If textType is selected as “dynamic”, then bitmap fonts will be used. Two bitmap fonts are committed to this repo (FreeSans and FreeSerif), if another font is needed, then it must be added properly. If textType is dynamic, a vertex buffer object is generated for that text and whenever text needs to be drawn, generated geometry is displayed. An advantage of bitmap fonts is memory effectiveness. Bitmap fonts have low memory footprint. As a side note canvas implementation only updates dirty regions but WebGL version always updates the whole screen if virtual DOM tree is invalidated.
Main drawback of bitmap fonts is localization support. Localisation is easier by using browser’s built-in fillText() command. When using bitmap fonts, all glyphs must be exported as bitmap. Another issue with bitmap fonts is kerning and glyph positioning. There might be errors using some fonts, position of some glyphs might be inaccurate.


