

To run the code, please do python main.py. I used python packages numpy, matplotlib and pandas.
This problem is an NP-complete problem. So it can not be solved using either dynamic programming or greedy algorithm. Of course brute force algorithm is an option but it is time consuming. Here I use parallel search algorithm inspired by evolutionary framework to attack the problem. As the data is shown as follows:
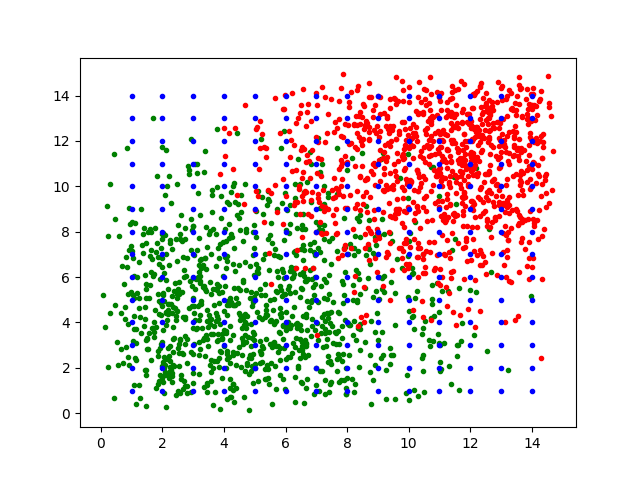
where the green, red and blu show the riders locations, riders destinations and potential bus stops, respectively.
My solution consists of the following steps:
- step 1: Partition
I do grid partitioning the covered space to 1x1 squares since 0<d(O,S_O)+d(D,S_D)<2
and Find the squares which have more density.
- step 2: Select bus stops for origin
Select a bus stop S_O for a square O which has the minimum average distance to the square O, to get more likely maximum
number of riders in O for that bus stop. This happens because more likely the probability of a potential customers in the square O who wants to go from the selected bus stop, S_O, is more, based on the origin location.
- step 3: Select bus stops for destination
Select a bus stop S_D which has minimum average distance to destinations of elements in square O, that you called D. The
advantage of this selection is increasing the probability of a potential customer who wants to go from origin O to destination D
chooses to get on a bus at stop S_O and get off at stop S_D.
- step 4: parallel search
Using parallel search algorithm start from 'M' different S_O s.
These start bus stations are chosen in a bias way that have more density.
And then using BFS algorithm, a bus is going from S_O to S_O' if the following three condition satisfied
1) d(S_O,S_D) > d(S_O', S_D)
2) L_{S_O} + d(S_O,S_O') < L_M , where L_{S_O} is the lenght of line containing bus stop S_O
3) d(S_O,S_O') + d(S_D, S_D') = Min_n [d(S_{O_n},S_O') + d(S_{D_n}, S_D), where O_n is in the M
This helps to increase the benefit by getting these shortest paths.
- Step5: Termination
a) Repeating step 4, ten times.
b) Select the one out of ten, with maximum profit.
As we can see in the following figure
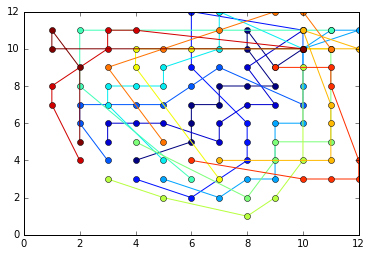
routes more likely go from south west to north east. An output.txt is provided in the repository in which the results and routes are shown. This result is given by running just one time algorithm and it maybe better if we do it in a for loop. The profit is a negetive number, that means this way of attack is not suggested. It might be modified by changing the maps, fitness functions as well.
P_i is a function whose value depends on the rider i and routh R and it is not clear for me since R is not used. When computing profit I assumed that rider i took maximum R.
This algorithm is not working properly when we arrange the start points for the bus stops in which we have the most density and maybe the cost is too much. So selecting the bus stops based on density of costumers is not working here! As you can see the algorithm main_density.py. in repository, which has a bad result.