Explore LinkedIn analytics using Evidence.dev to build dashboards entirely in code, version-controlled and reproducible.
- Install the Evidence VS Code Extension
- Open Command Palette (
Ctrl/Cmd + Shift + P) →Evidence: New Evidence Project - Click Start Evidence in the bottom status bar. This installs dependencies, generates sources from CSVs, and opens the preview.
# If using CLI directly:
npm install
npm run sources           # Generate all sources (CSV → SQL tables)
npm run dev -- --host 0.0.0.0 # Start development serverThis project demonstrates:
- Data was transformed, aggregated, and queried using SQL to create meaningful insights from CSV sources.
- Build dashboards with:
- Treemaps for categorical breakdowns
- Line charts for trends over time
- Bar charts for comparisons
- CSV sources, queries, and dashboards are all version-controlled.
- Makes analytics auditable and shareable across teams.
- The app is deployed and publicly accessible here:
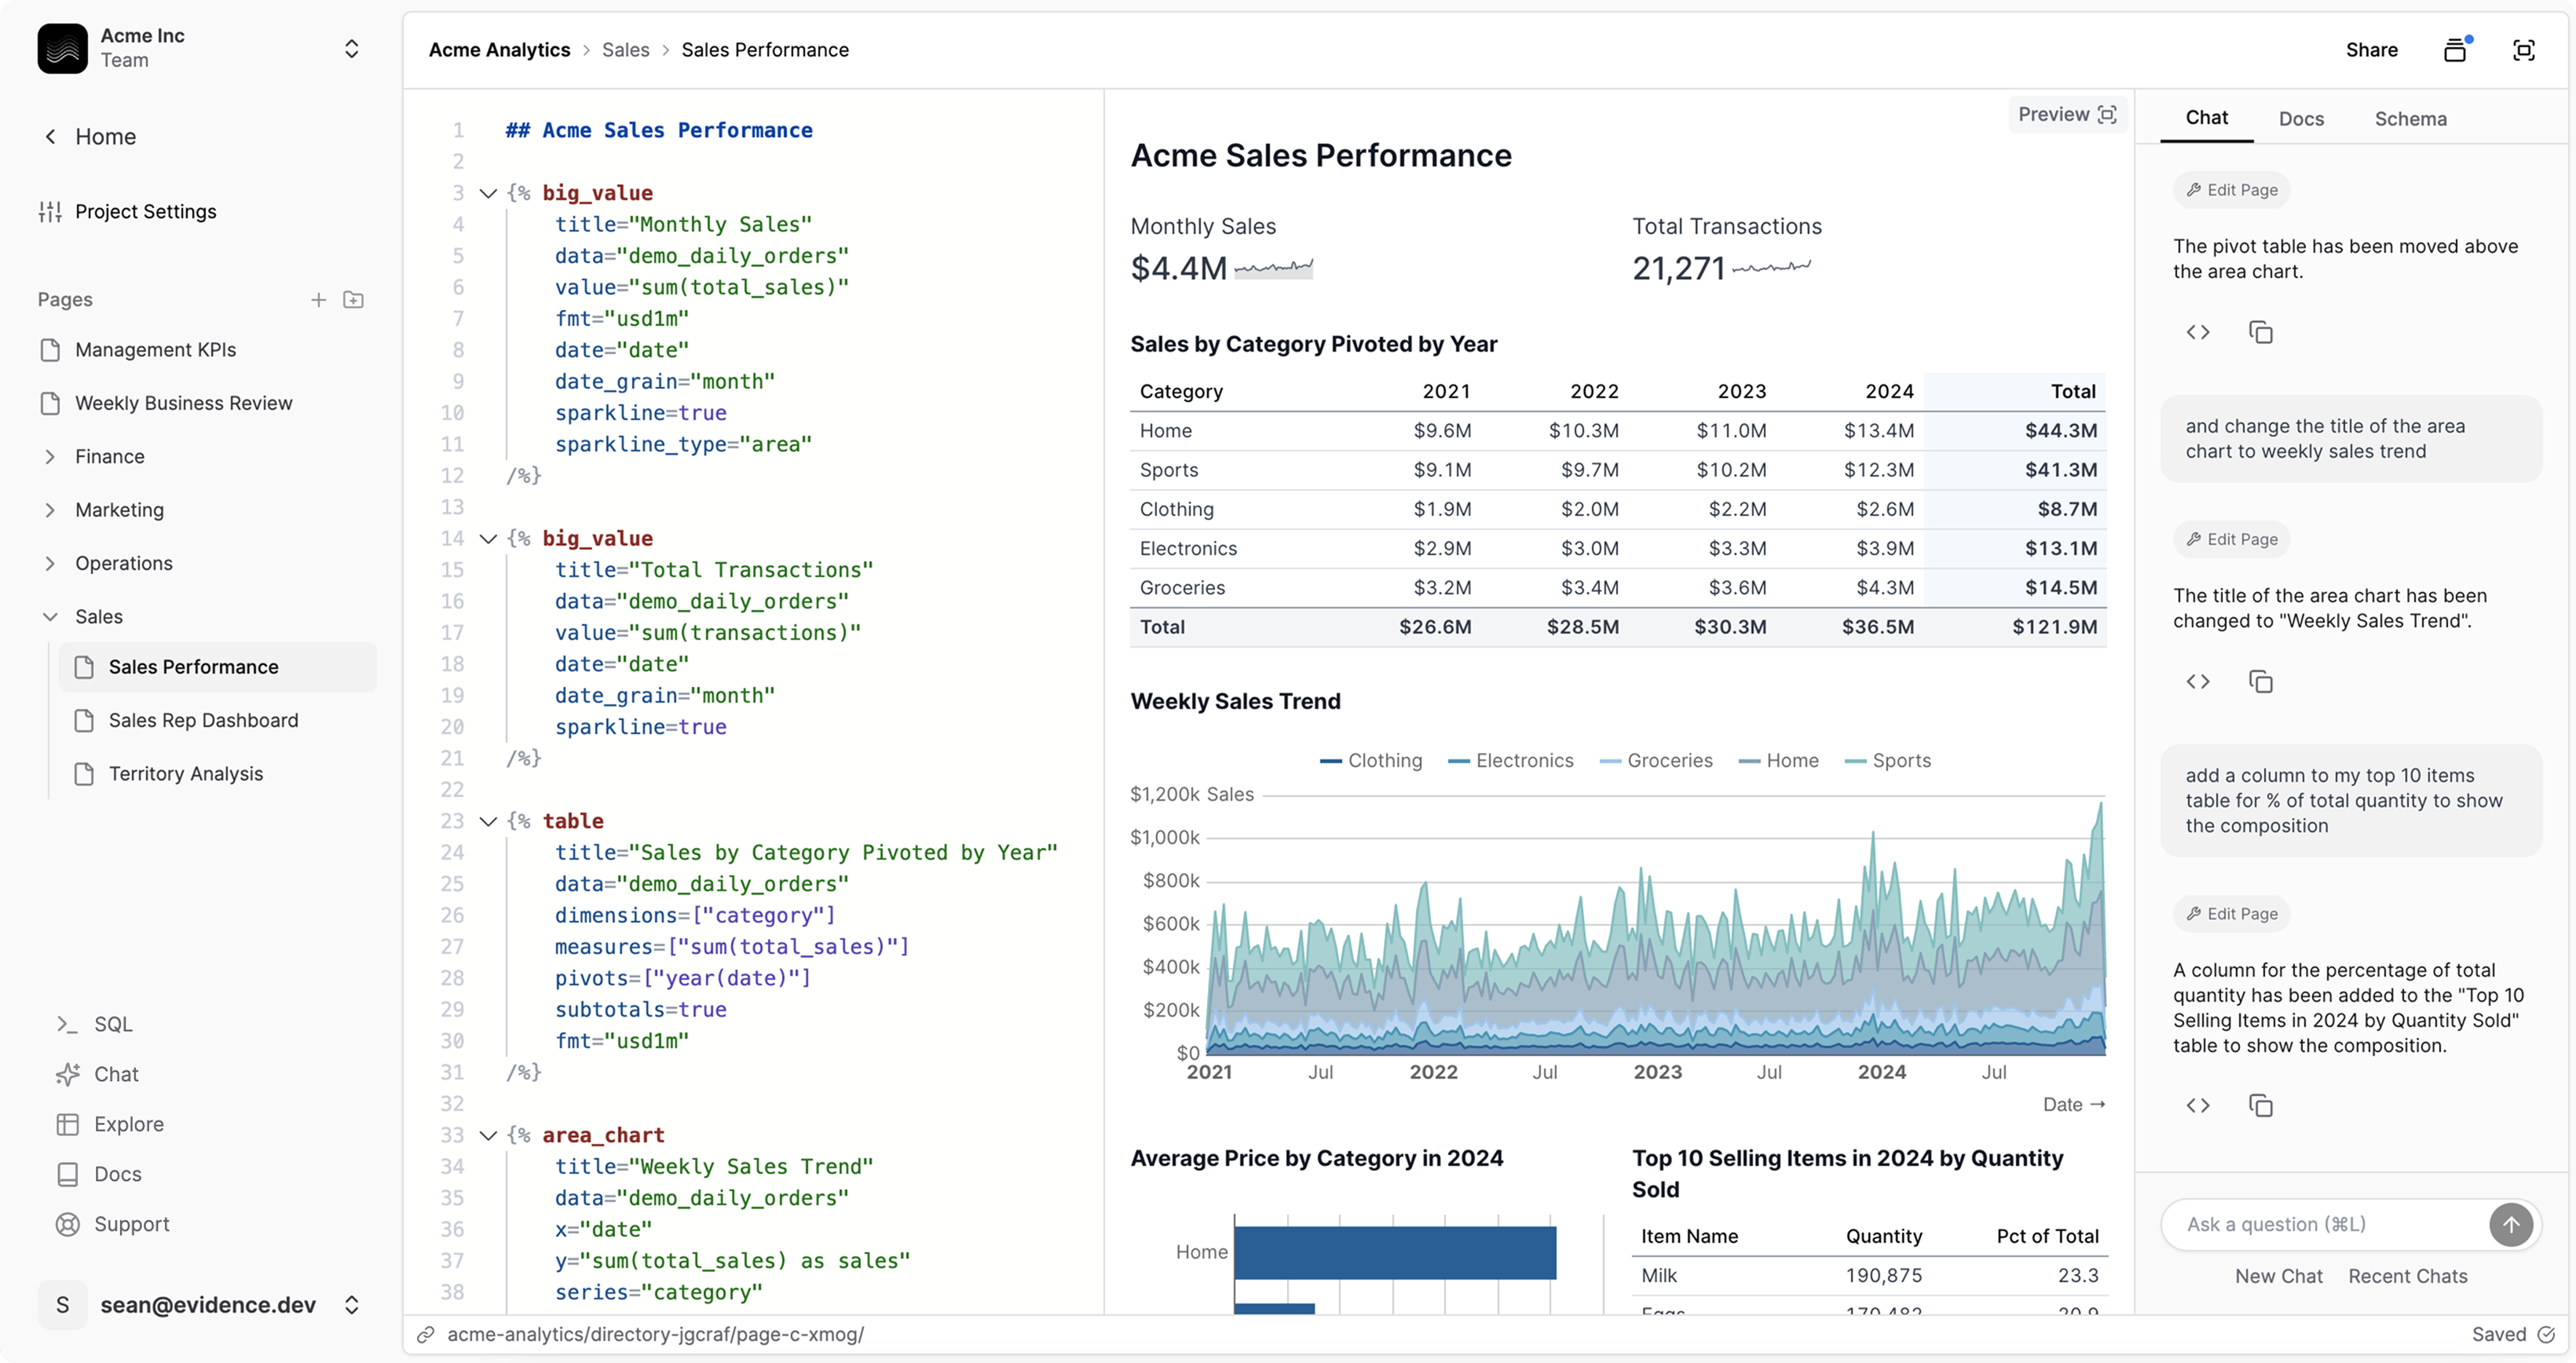
BI as Code Dashboard