The trouble is that thought and culture are not the sort of thing that can have distinct units. They do not have a granular structure for the same reason that ocean currents do not have one — namely, because they are not stuffs, but patterns.
— Mary Midgley, Myths We Live By
Data dominates. If you've chosen the right data structures and organized things well, the algorithms will almost always be self-evident. Data structures, not algorithms, are central to programming.
— Rob Pike (one of the creators of Go)
I've never been good at fitting into a box. It's not that I'm contrarian — quite the opposite, I tend to be the person nurturing community and consensus when I'm in a group — it's that my curiosity is a few orders of magnitude too large for my simple human body. I want to learn and do and build and experience All the Things — Cantonese AND Mandarin, music AND maths, software engineering AND data analysis. This drives my foundational love for data: collecting and analyzing data empowers us to form stories beyond our direct experience. With data, we can weave ideas and understanding out of complex events that span space and time (even into the future!). Given this fundamental framing, my fascination with data ranges all over the place — and I'm just as interested in building tools for the work as the work itself. So am I an Analyst or Data Engineer (or Software Developer, Developer Experience Advocate, Teacher, Consultant, Manager...)? So far the answer is 'yes'.
So, the best description of my work I've come up with is Data Cowgirl. No fences, just wide open land, riding around on my trusty stallion Bracket, making sure all the data is1 thriving. Nurture it, help it grow strong. When the leaves turn, go shear it, then spend the long winter weaving it into tapestries. That kind of thing.

To be less...poetic2 about it: the way my enthusiasm manifests — the work I'm doing, my title — has evolved a lot over time, and I expect it will continue to for the rest of my life. So far, I've spent professional stretches doing all of the following:
- building industry-leading enterprise SaaS platforms AND building lovingly crafted OSS CLIs
- constructing durable streaming data platforms for SOTA factories AND constructing warehouses for education non-profits, carefully designed to never tick over BigQuery's free tier
- weaving gnarly collections of legacy data sources into a cohesive world AND weaving passionate human beings into supportive and effective communities
- designing beautiful web apps AND designing resilient, reusable patterns for data work
- managing analytics for diverse teams AND managing my own teams
- writing in-depth docs on Python SDKs AND writing mythopoetic explorations of what we mean by "true" in data work
- also, just a lot of time making some of the best memes in the data space 😌
🎷🐄 You get the idea — data cowgirl. No matter the particulars, the mission is always:
- 🌱🍄🟫 Nurture data ecosystems with technical rigor and deep empathy
- ✨🕸️ Get people excited about their ability to do amazing things within it
- 🗺️🌊 Work together to understand this world a little better every day 🫶
Giddyup!
I build open source and source available data tools through a small solo firm called Supermodel, which I use and refine in my freelance data cowgirling work. The ones I'm most excited about are still baking, but there are a growing number of nice OSS utils available via my Homebrew tap and PyPI now.
I love the command line, Neovim, shells, scripts, CLIs, and TUIs and spending waaay too much time gardening my dotfiles. I'm really stoked about the terminal renaissance we're seeing from Claude Code! Seeing more people reach for the precision, speed, and control of the command line is so welcome after a decade of trying to wrap everything in a GUI.
There's so much value both directly and more broadly in the practice of crafting the perfect sharp tools for your own work — so AI's melting of the friction here is one of the most exciting shifts for me. I've loved writing powerful and delightful command line tools in Go with the Charm libraries for a long time. AI has drastically expanded what I'm able to build now, and I've been leaning into it fully. The frameworks outside of golang's Charm ecosystem that I've been using the most are Deno with Cliffy for network-heavy agentic tools, and Python with Typer for multi-threaded local text processing tools. I'm planning to spend more time building in Rust at some point this year though, ratatuti has been calling my name for a while now.
- DuckDB
- Amazing stuff in the ecosystem — like the Airport extension
- DuckLake,in my opinion a superior data lake standard over Iceberg
- MotherDuck, the best warehouse for 90% of businesses not operating at massive scale, and a fantastic example of cohesive developer experience + brand
- Daft and DataFusion running on platforms with fantastic developer experiences like Modal as the new way to handle massive multi-modal work
- The convergence on Parquet + Arrow lakes with flexible compute and query engines accessing them is just generally a huge improvement (speaking as somebody who has migrated a lot of data between BigQuery ⇄ Snowflake ⇄ Redshift ⇄ Databricks) — companies like Columnar are doing amazing work spreading ADBC as the new standard
- Marimo (their cloud platform runs on Modal!) — I'm forever in love with literate programming as a paradigm, and Marimo is such a massive step forward there over Jupyter
- Hex, hands-down best BI tool in the world (maybe ever? probably ever.) — again, literate programming wins
If you like my recommendations and want more: my collecting/scrapbooking/journaling/organizing/labeling instinct is powerful, so I am a dedicated GitHub Stargazer — you're welcome to explore my lists!
If you're still here, I guess it's safe to get a little spicy. I'll leave you with some of my more heterodox beliefs:
-
Data visualization is really overrated! Don't get me wrong, I love great data visuals, and there are tons of analyses where they help communicate in a way words can't (I'm a girl with the complete works of Tufte on my shelf who gets very excited when a new issue of The Pudding drops) — but we have come to see visualization as the standard output, that should only rarely be deviated from. In spite of half a decade lamenting the deficiencies of dashboards, they remain the final destination of all this engineering and modeling effort in most people's minds. We're past due to realize that a summary of interesting shifts in this week's revenue metrics might work better as a sentence or a table. Blessedly, AI is finally getting us to the post-dashboard promised land.
-
You're looking at too much data. The reality is, your brain cannot track a dashboard of 50 metrics hour-by-hour, day-by-day in a way that is actually useful and effective. Metrics are a tool for observing experiments that help you map out the physics of your business. It's that knowledge, the metrics themselves, that has value. While it is undeniably cool to ace the CEO's pop quiz at a board meeting with a ratatat of punchy metrics that would make Aaron Sorkin proud — that is theater, not impact. Save chart watching for the chaotic crises and focus on your energy on feedback loops that iteratively build knowledge for the long term.
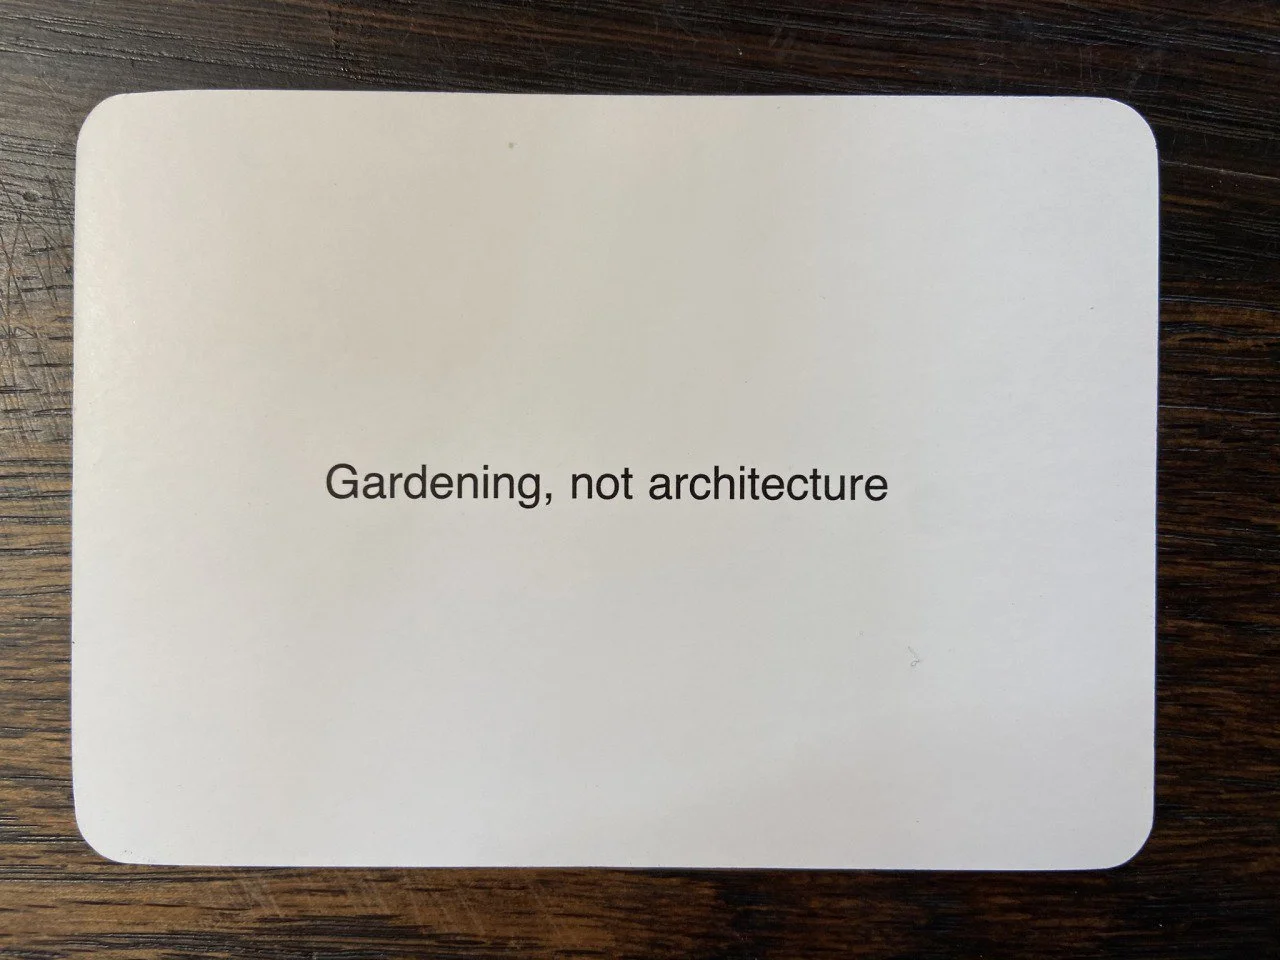
🃏🧚🏼 In parting, my favorite card from Brian Eno's famous Oblique Strategies deck...
     ∧_∧
  ry´・ω・`ヽっ
  `!     i
   ゝc_c_,.ノ
    (
    )
 .∧_∧.(
(´・ω・ ∩
o   ,ノ
O_ .ノ
 .(ノ