This work has been developed by searching for information in the GMIT library database and web pages.
My final work on these tasks can be found in the Jupyter Notebook Python SQRT2.ipynb file.

Write a Python function called sqrt2 that calculates and prints to the screen the square root of 2 to 100 decimal places. Your code should not depend on any module from the standard library1 or otherwise. You should research the task first and include references and a description of your algorithm.
The Chi-squared test for independence is a statistical hypothesis test like a t-test. It is used to analyse whether two categorical variables are independent. The Wikipedia article gives the table below as an example(1), stating the Chi-squared value based on it is approximately 24.6. Use scipy.stats to verify this value and calculate the associated p value. You should include a short note with references justifying your analysis in a markdown cell.
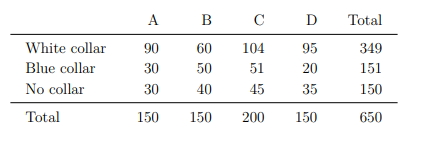
(1) Wikipedia contributors, “Chi-squared test — Wikipedia, the free encyclopedia,” 2020, [Online; accessed 1-November-2020]. [Online]. Available: https://en.wikipedia.org/w/index.php?title=Chi-squared_test&oldid=983024096
The standard deviation of an array of numbers x is calculated using numpy as np.sqrt(np.sum((x -np.mean(x))**2)/len(x)). However, Microsoft Excel has two different versions of the standard deviation calculation, STDEV.P and STDEV.S . The STDEV.P function performs the above calculation but in the STDEV.S calculation the division is by len(x)-1 rather than len(x) . Research these Excel functions, writing a note in a Markdown cell about the difference between them. Then use numpy to perform a simulation demonstrating that the STDEV.S calculation is a better estimate for the standard deviation of a population when performed on a sample. Note that part of this task is to figure out the terminology in the previous sentence.
Use scikit-learn to apply k Nearest Neighbours clustering to Fisher’s famous Iris data set. You will easily obtain a copy of the data set online. Explain in a Markdown cell how your code works and how accurate it might be, and then explain how your model could be used to make predictions of species of iris.
Series:Community Experience Distilled Authors: Rossant, Cyrille Publication Information: Ed.: Second edition. Birmingham, UK : Packt Publishing. 2015 Resource Type: eBook
IPython Interactive Computing and Visualization Cookbook : Over 100 Hands-on Recipes to Sharpen Your Skills in High-performance Numerical Computing and Data Science in the Jupyter Notebook, 2nd Edition
Series:Community Experience Distilled Authors: Rossant, Cyrille Publication Information: Ed.: Second edition. Birmingham : Packt Publishing. 2018 Resource Type: eBook
Hands-On Data Analysis con NumPy y pandas: Implementar Python Paquetes De Datos manipulación para procesamiento
Authors: Miller, Curtis Publication Information: Birmingham: Packt Publishing. 2018 Resource Type: eBook
Series:Community Experience Distilled Authors: Idris, Ivan Publication Information: Birmingham, U.K. : Packt Publishing. 2014 Resource Type: eBook
Authors: Fandango, Armando Publication Information: Ed.: Second edition. Birmingham : Packt Publishing. 2017 Resource Type: eBook