This project consists of a set of MATLAB scripts designed to extract, analyze, and visualize geographical data, focusing on land and river variables such as evaporation, runoff, and irrigation. It processes NetCDF files, generates comparative plots between different datasets or model cases, and produces diagnostic plots.
The scripts require the following MATLAB packages:
- M_Map: For creating map projections in plots.
- Available at: https://www.eoas.ubc.ca/~rich/map.html
- cptcmap: For using custom colormaps in plots.
- Available at: https://github.com/kakearney/cptcmap-pkg
Please ensure these packages are installed and added to your MATLAB path before running the scripts. It is also recommended to review main.m for any hardcoded paths (e.g., for addpath, matdir, outdir) and adjust them to your specific environment.
main.m: The main script to configure and run the entire workflow. It sets up parameters for data extraction and plotting, then calls the other functions.extract_land_river.m: This function extracts specified land and river-related variables from NetCDF (.nc) input files based on the configuration provided inmain.m. The output is saved as a.matfile in thematdirdirectory.compare_plot.m: This function takes the processed data (from.matfiles) for two different cases and generates comparison plots for specified variables (e.g., wrmflow, runoff, evap). Output images are saved in theoutdirdirectory with filenames incorporating the variable name and timestamp (e.g.,evap.YYYY-MM-DD-SSSSSS.png).diag_plot.m: This function generates diagnostic plots, such as irrigation budget analysis (comparing ELM and MOSART-WM outputs ifextract_irris true) and spinup time-series plots (for variables like sensible heat, latent heat, total water storage, etc.), based on the extracted data. Output images are saved in theoutdirdirectory.sample_img/: This directory contains sample images generated by the scripts, such asevap.15-Oct-2020-17-20-26.951.pngandrunoff.15-Oct-2020-17-20-23.756.png.
-
Prepare Environment:
- Ensure MATLAB is installed.
- Install the M_Map and cptcmap packages and add them to your MATLAB path.
- Open
main.mand update theaddpathlines at the beginning of the script to point to the locations of these packages in your environment. - Modify
matdir(for.matdata files) andoutdir(for plot images) inmain.mto your desired output locations.
-
Configure Parameters: Open
main.mand modify the input parameters as needed. Key configurations include:rawdir: Cell array of strings specifying the directories containing the raw NetCDF input files for different cases.casename: Cell array of strings for the names of the cases to be processed.years: Cell array of strings, each containing a numerical range of years for data extraction (e.g.,num2str(1850:1865)).components: Cell array of strings specifying the model components from which to extract data, using a '+' delimiter (e.g.,'elm+mosart','eam+elm+mosart').extract_irr: Cell array of logical flags. If true, irrigation-related variables (e.g.,QIRRIG_WM,WRM_IRR_DEMAND) will be extracted. Ensure your model output contains these variables if set to true.irr_budget: Cell array of logical flags to generate irrigation budget diagnostic plots.spinup_plots: Cell array of logical flags to generate spinup diagnostic plots.bgc: Boolean flag to indicate if it's a BGC (Biogeochemistry) run.mat_overwrite: Boolean flag to overwrite existing.matfiles.matdir: String specifying the directory to save the processed.matfiles. Note: This path is also configured at the start ofmain.mand may need adjustment there too if different from the general output directory logic.outdir: String specifying the directory to save the generated plot images. Note: Similar tomatdir, this path is also configured at the start ofmain.m.variables: Cell array of variable names (strings) to be plotted bycompare_plot.m.bounds: Numeric array defining value ranges for the comparison plots incompare_plot.m, one row per variable.absolute_compare: Boolean flag; if true,compare_plot.mshows absolute differences, otherwise relative differences.package_color: Boolean flag to use the M_Map and cptcmap packages for enhanced plotting incompare_plot.manddiag_plot.m.
-
Run the Main Script: Execute
main.mfrom the MATLAB environment.main -
Outputs:
- Processed data will be saved as
.matfiles in the directory specified bymatdirinmain.m. - Generated plots (PNG images) will be saved in the directory specified by
outdirinmain.m. Filename examples:evap.YYYY-MM-DD-SSSSSS.pngforcompare_plot.m, andirr_budget.CASENAME.YYYY-MM-DD-SSSSSS.pngorSpinup.CASENAME.YYYY-MM-DD-SSSSSS.pngfordiag_plot.m.
- Processed data will be saved as
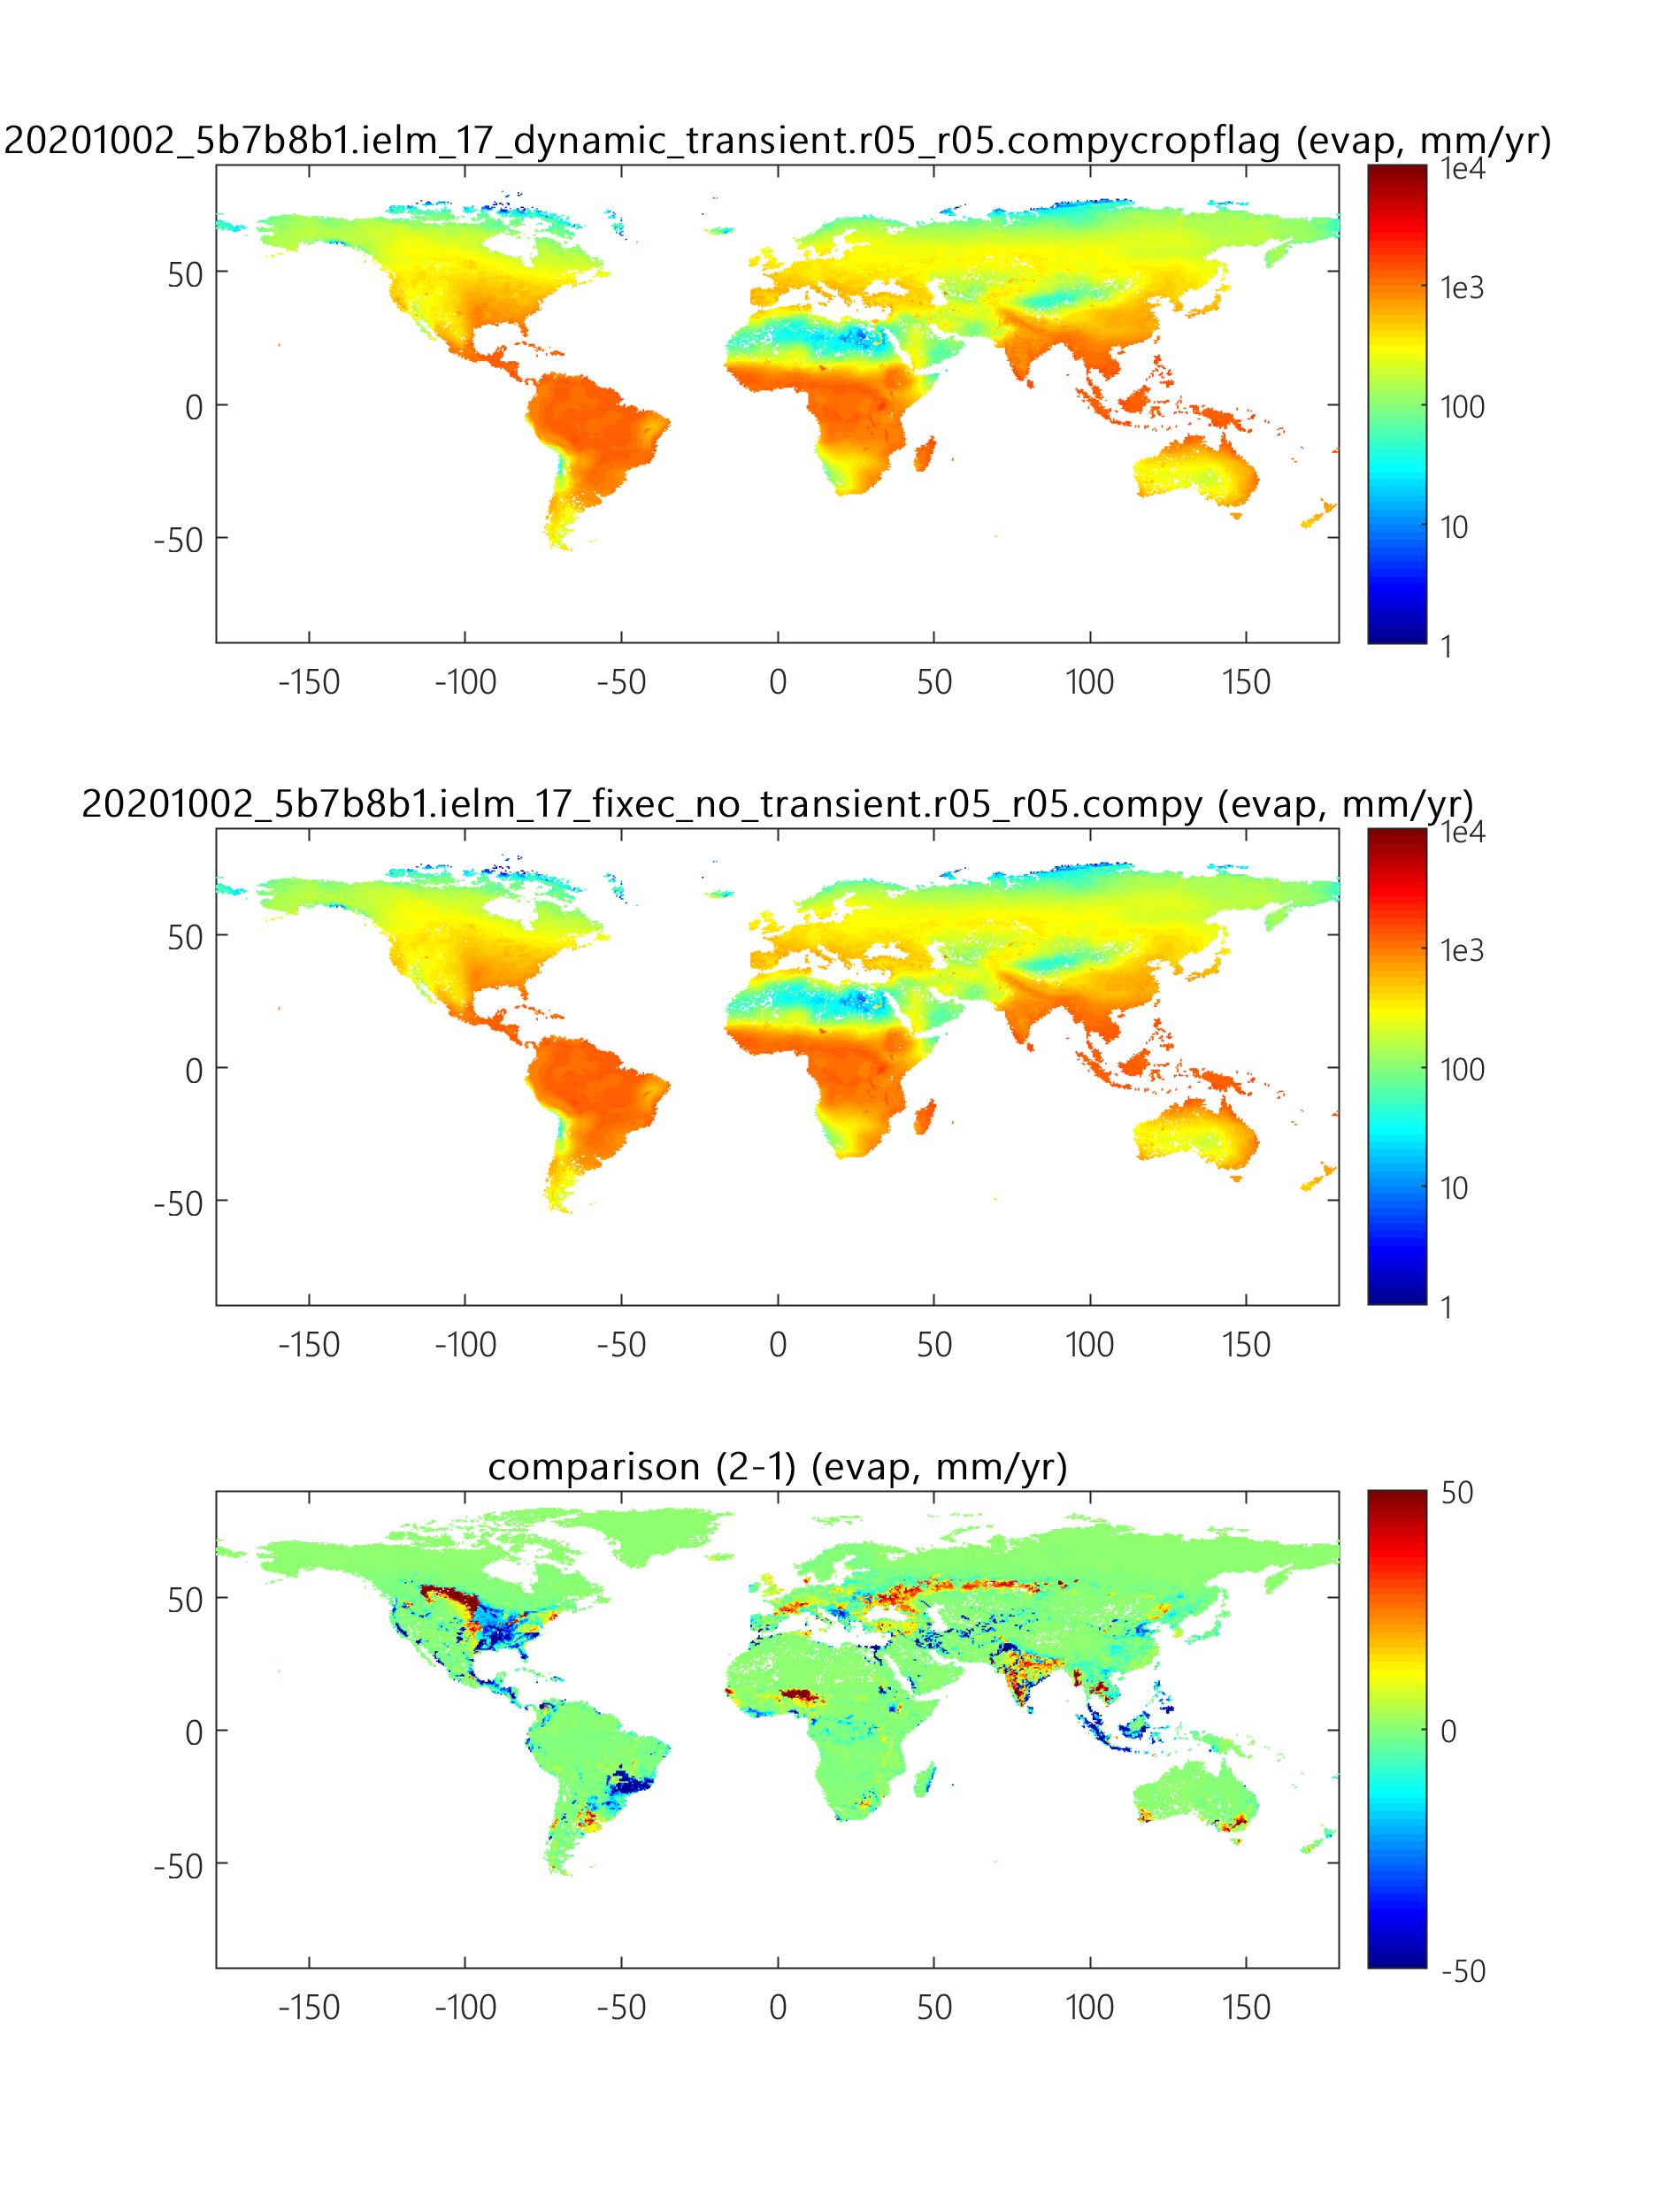
The scripts generate various plots, including:
- Maps showing the spatial distribution of variables like evaporation and runoff.
- Comparison maps showing differences (absolute or relative) between two cases.
- Time-series plots for spinup diagnostics.
- Irrigation budget plots.
Examples of generated images can be found in the sample_img/ directory.
Tian Zhou [email protected]
This project is licensed under the terms of the LICENSE file.