Conversation
 aflaxman
left a comment
aflaxman
left a comment
There was a problem hiding this comment.
I like it. Does the terminology here correspond to Nathaniel's latex writeup?
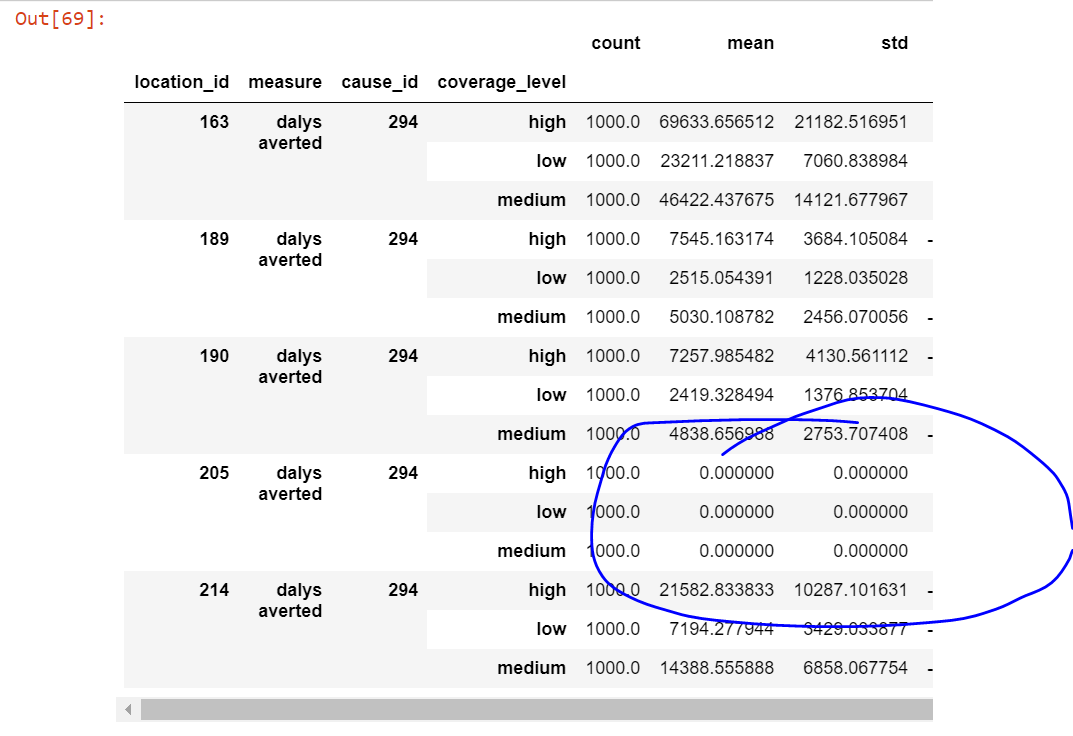
What is up with the 0 DALYs averted in one location?
|
The terminology largely aligns with Nathaniel's write-up, but I will update to completely align - I think that is a good idea. The location with zero coverage has exactly the same values for eats_fortified and eats_fortifiable in our coverage data. Both of these values are slightly less than eats_vehicle, so when we layer in that additional piece of the scale-up, there will be non-zero values, but they will be very small. |
Rather than aligning it with my math notation, it might be better to use more descriptive variable names, e.g. "p_counterfactual" or "p_intervention" instead of "p_star." Or even spell out "prevalence" or "coverage" instead of "p" and "alpha." In my view, the difference is that math notation should ideally be compact and easy to visually digest, whereas code should ideally be self-explanatory. |
Two comments on this, both of which can be addressed by adding assert statements (though if they fail, it might require more work):
Since you're not truncating, I think you should add an assert statement to verify that all draws are between 0 and 1.
Are you sure that setting the random seed will cause the percentile ranks to be the same? That's plausible, but it seems like a scipy implementation detail that I wouldn't want to dig into. I think you should add an assert statement after the for loop to verify that |
|
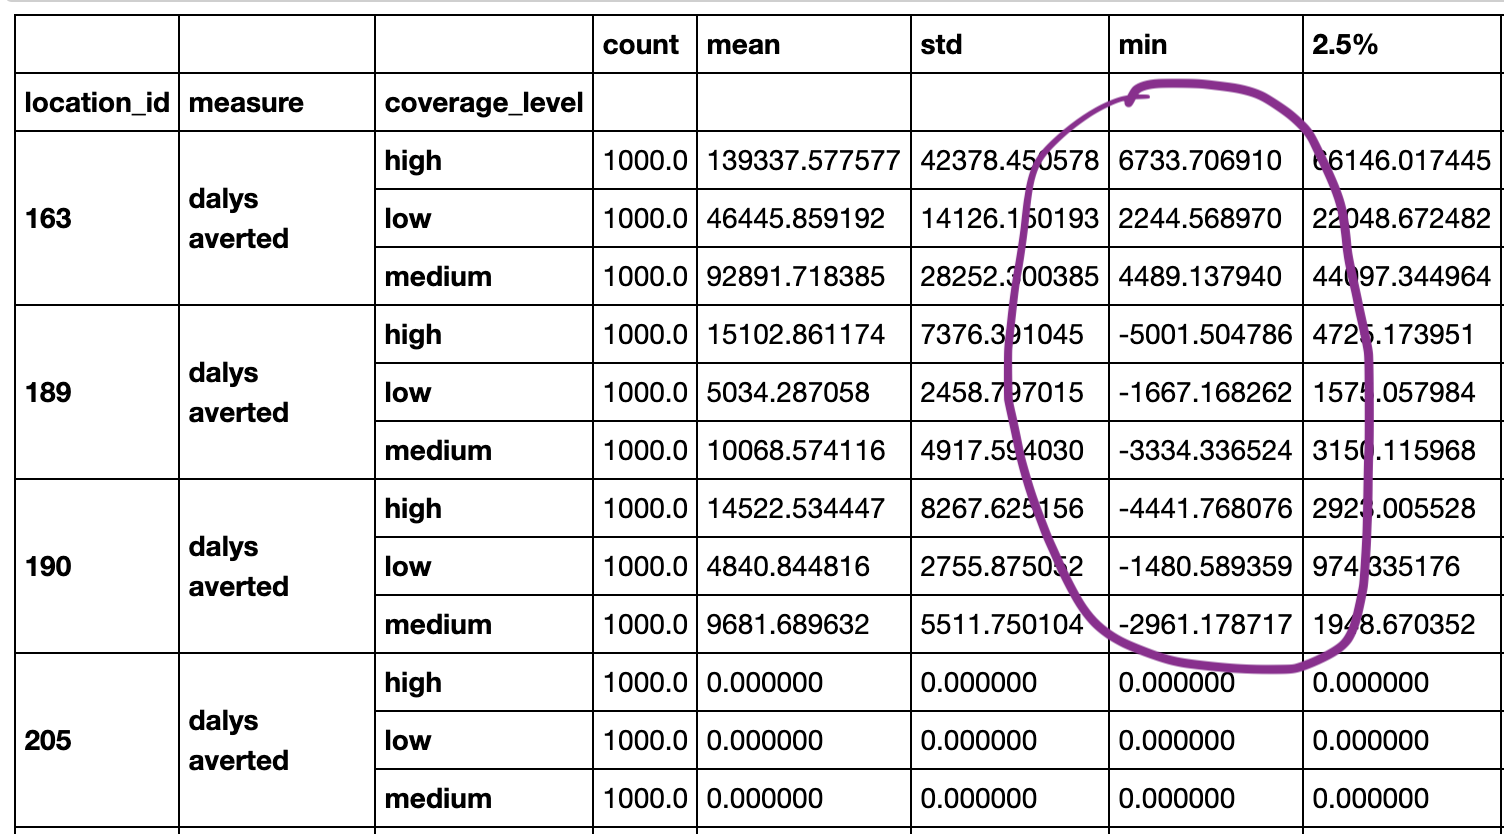
Why is the minimum DALYs averted negative in some locations but not others? Is this due to the relative risks, the effect size, or both? I think I would expect to get a negative value for all locations since the relative risks should be the same across locations...
|
|
@NathanielBlairStahn I think you are looking at an old version of the notebook before I updated a few things -- now the minimum value for all locations is negative and it is updated to a truncated normal assumption for the coverage parameters. I am not sure why the value you highlighted is the way it is, but I can check out the old commit and see if I can see if that issue was silently propagated forward. I will add an assert statement to ensure alpha <= alpha_star and also update the terminology :) |
@alibow Oh ok, I don't know why the version I was looking at was out of date. Is the above code the most current? I still have one comment: I haven't used a scipy truncnorm distribution before, but if I'm understanding the documentation correctly, it looks like you're truncating values at the endpoints of the confidence intervals for our data (i.e. the 2.5-percentile and 97.5-percentile for the estimate). But we really just need to make sure the values are between 0% and 100% because they're proportions, so I think it should be: Does that look right? |
No description provided.