
At work, we got some CO2 sensors and a strict instruction: "When this turns red, ventilate the room." I had never really thought about it before, but it got me wondering who doesn't like fresh air. Office work often involves being deeply focused on a task, and you easily stop noticing how stuffy the air has become. Now, however, there is a metric to rely on.
Even though these sensors cost quite a bit, they don't do anything other than show the reading on the screen, whereas it would be useful to collect all kinds of metrics... But at work, people's attitude toward this was not very serious, so the idea didn't go any further.
While scrolling through AliExpress, I came across the SCD40/41 and SCD30 sensors and bought them. During conversations with hobbyist friends, a question came up about why the driver for the SCD40/41 wasn't working, and the author wasn't offering any help. Since I already had the sensor anyway, I downloaded the first datasheet I could find and implemented what was described there—nothing particularly difficult: just command transmission. I offloaded most of the work to "T9++" and focused on handling communication recovery mechanisms in case of temporary communication loss on the I2C line. Later, it turned out that there were several revisions of the document. I had to look up the latest one and implement the remaining commands.
I tried it out and tested for temporary data line and power cuts—everything worked. So, I published the component.
In general, I've made it a habit that if I implement a custom component, I publish it to the official ESP Component Registry. This makes it much easier to reuse my own components in future projects.
Another one of my long-running projects is a graphics library for ESP32. I rewrote it once again "in search of the perfect API." At this point, the main architecture has been thoroughly refined through trial and error and is unlikely to change, but I keep adding new features as needed.
It so happened that while testing a new round screen, I also had the CO2 sensor on hand, so I decided to take on the project of building a measurement station. At the same time, I decided to upgrade my skills in 3D printing and 3D modeling for it, as I was a beginner in both areas.
I haven't used the SCD30 anywhere yet: it is quite bulky, although its readings are likely more precise. The SCD40/41 is considered a good sensor for "consumer" applications. It doesn't require a large enclosure, supports automatic self-calibration, and also measures temperature and relative humidity, which it then uses for automatic internal compensation of its own readings. I bought the SCD41, which differs from the SCD40 mainly in its measurement range: the SCD41 goes up to 5000 ppm, while the SCD40 goes up to 2000 ppm.
Excerpt from the documentation:
The Sensirion SCD41 sensor is one of the most accurate and compact miniature carbon dioxide (CO2) sensors on the market. It operates on the photoacoustic principle (PAS) and is widely used in professional ventilation systems, smart home automation, and portable devices.
Its main accuracy specifications are:
- CO2 Accuracy: ±(40 ppm + 5%) of the current reading
- CO2 Measurement Range: 400 to 5000 ppm
- Temperature Accuracy: ±0.8 °C (compensated by the built-in sensor)
- Humidity Accuracy: ±6%
Strengths: Why is it so accurate?
- Built-in Compensation: The sensor features integrated temperature and humidity sensors, allowing it to automatically correct CO2 readings based on the room's indoor microclimate.
- Direct Measurement: This is a genuine optical NDIR sensor, not an estimated CO2 (eCO2) sensor that guesses carbon dioxide levels based on other volatile organic compounds.
- Automatic Self-Calibration (ASC): The sensor self-calibrates based on the minimum fresh outdoor air level, typically assumed to be 400 ppm, when the room is ventilated. This protects it from sensor drift over time.
After quickly connecting the display, sensor, and ESP32 development board, I started writing a program to display the air quality. Since I wanted to leverage the capabilities of my graphics library, I added animations and a custom font designed specifically for this purpose. This font is defined not by binary matrices, but by pixel coordinates arranged in a special order, as if they were drawn by hand. When rendering to the screen, each point of a character is drawn as a matrix of pixels (a kind of "fat" dot), but due to library-level optimizations, the overall animation remains smooth.
Later, I thought it would be nice to be able to turn off the display—for example, if the room is dark and you don't want any glowing light. This led to adding a contactless touch button using the TTP223 sensor. Unfortunately, my display module does not have backlight control, so a faint glow remains visible in the dark.
Currently, the control logic is as follows:
- A short tap turns the display on or off;
- A double tap, if Wi-Fi is already configured, launches the web server with the device configuration page and shows the IP address of the settings web server at the bottom of the display;
- A long hold for 5 seconds switches the device to BLE Wi-Fi provisioning mode and displays a QR code for the Espressif application.
If no new settings are applied within 60 seconds, or if nothing has actually changed, the device simply returns to normal operation. If new Wi-Fi credentials are received, once configuration is successfully completed, the device restarts and connects to the network using the new settings.
Displaying the air quality is useful on its own, but we can also add practical integration: the device transmits data via the MQTT protocol, allowing a smart home system or any similar setup to gather the information. Currently, the readings are integrated into Home Assistant.
The device reports measured values for CO2, temperature, humidity, and the Wi-Fi signal strength.
Since the network must be initialized anyway, I wanted to make the Wi-Fi setup more modern: using BLE provisioning with a QR code for the Espressif BLE Provisioning app, which is available in the official Google Play and App Store. If the network is already configured, a double tap opens a local web server with the configuration page.

The following parameters can currently be configured via this web server:
- MQTT address;
- MQTT username;
- MQTT password;
- Device name;
- Local hostname of the device (used for registering on the network);
- Time zone;
- CO2 offset;
- Temperature offset;
- Humidity offset.
Parameters are stored in the device's internal memory, and reading corrections are applied to current measurements.
Measurement correction here is an empirical adjustment using a single reference point, rather than a full calibration: only an offset relative to current measurements is specified. According to my observations, the sensor in my build overestimates humidity by about 5 percentage points, which is within its documented margin of error.
The temperature offset is also written directly to the SCD41 sensor itself (the self-heating compensation register), so it is processed in hardware. There is an vital detail here: this register in the SCD41 does not function like a simple software addition to the measurement. The higher the value in the register, the lower the resulting temperature, because the sensor compensates more heavily for its own heat.
Because of this, the temperature offset in the settings has a more intuitive "human-readable" meaning: a positive value increases the displayed temperature, while a negative value decreases it. Internally, the firmware translates this into a hardware register value relative to the factory calibration of the SCD41, which defaults to 4 °C. For example, if the sensor shows 30.3 °C and the real temperature is 27.1 °C, you need to set an offset of -3.2 °C. The firmware will translate this into a value of 7.2 °C for the SCD41 hardware register: the larger this value, the more the sensor compensates for self-heating, making the final temperature reading lower.
For my design, this indirectly suggests that the insulation of the sensor from the rest of the electronics is done reasonably well. The SCD41 already has a default temperature compensation of 4 °C, and in my case, I had to add only about another 0.8 °C to it. This means that the main portion of this correction is likely related to the sensor's own standard self-heating rather than excessive heat generated by the board or display inside the enclosure.
Once the devices were connected to a standard ESP32 development board and the program was performing its key functions, I decided to try switching to a smaller board: the ESP32-C3-Zero. I wasn't sure if we would have enough GPIOs, if the 3.3V power supply would be sufficient for all peripherals, or how to fit everything inside a compact enclosure.
We had just enough pins with nothing to spare. The board is extremely small, with few GPIOs, and some of them double as bootstrap pins, meaning they are not suitable for every task. The pros of this board are its miniature size and low price; the cons are the limited number of pins and little room for connecting anything else. Another question was whether the built-in SRAM would be sufficient. For animations, I constantly use virtual screens, which demand memory. In the end, the board's capabilities proved to be enough, which defined the subsequent design of the device's enclosure.
Due to how the board is positioned inside the enclosure, the pins had to be soldered pointing upward, toward where the connected peripherals are situated. There needs to be plenty of solder so the pins hold firmly, but no excess solder should end up on the outer edges of the board; otherwise, it won't slide into the mounting slots easily. The pins had to be bent sideways so the wires wouldn't interfere with the display support brackets.

There were doubts about the trace routing quality of the onboard antenna. Although it looked decently made, its tiny size and experience with similar boards pointed to potential signal reception issues.
I bought silver-plated copper wire for some experimentation, but I haven't carried out the test yet—in my environment, the signal reception turned out to be perfectly fine as is. But if it were ever needed, there is space in the enclosure for it, so the reception could be improved.
I used a GC9A01 round display module with a 1.28-inch diameter. A speedometer-style gauge looks great on it.

Any 5V power supply connected via a USB Type-C cable is suitable for powering the device. Autonomous battery power is not built into the enclosure, but a portable power bank can always be used instead.
Upon calling app_main(), the program initializes the display, touch button, Wi-Fi, and then creates a dedicated FreeRTOS task for the SCD41. This task is responsible for interacting with the sensor: polling it, applying corrections, updating the hardware temperature compensation if needed, and publishing only the fully prepared air quality state.
When working with different hardware peripherals on separate buses in parallel under individual tasks, it is best not to access the same hardware from multiple tasks. Instead, pass necessary messages between them so that each hardware peripheral is managed by exactly one task.
Meanwhile, the main loop handles the screen and device logic: reading the latest measurements from the queue, processing TTP223 gestures, managing provisioning mode, and updating the display. This separation simplifies the logic: sensor routine delays do not block the UI, and the screen task does not directly interfere with the I2C communication of the sensor.
Before a new state is pushed to the queue and published over MQTT, the CO2 value is additionally averaged over the last four readings. This slightly smooths out the sensor's natural noise and prevents the needle and digits on the screen from jittering. Currently, temperature and humidity measurements are sent without such averaging, as it seems the sensor handles this internally.
The screen is not fully redrawn on every pass of the main loop. Updates are event-driven: triggered when a new reading arrives from the sensor task, when the minute changes on the clock, or when a step in the digit-morphing animation needs to be rendered. This significantly reduces microcontroller load and makes the interface more responsive.
In addition, special operating modes are accounted for. If the display is turned off, redundant redrawing is skipped. If provisioning is active, the regular display temporarily gives way to the Wi-Fi setup interface, and upon completion, the system restores the screen back to its normal operating mode.
One feature of my graphics library is its font support. It includes a character format where symbols are defined by point coordinates. This is convenient for creating morphing effects when transitioning from one character to another. When rendering this font, a pixel matrix matching the size of the chosen font point is used. Font point sizes larger than 5 are rendered as a "sphere": circles with brightness fading from the center to the edge. Point sizes from 1 to 5 are fine-tuned by hand.
The morphing transition from one character to another takes several steps. First, two coordinate arrays are generated: one for the starting character and one for the destination character. Next, the number of coordinates in these arrays is equalized by repeating the last point in the shorter array. The transformation function then calculates the displacement of each point along the line from the old coordinates to the new ones based on a parameter

Of course, the most important function is displaying the measured CO2, temperature, and humidity. Still, whenever I look at a device like this, I naturally expect to see the time as well. To display the time, the system needs to know the time zone. Copying a tzones.c file from project to project, which inevitably becomes outdated, is not the best approach. Because of this, I added automatic generation of the available time zone list using a Python script during the project build process.
The microcontroller must dynamically generate HTML settings pages. Keeping these pages directly inside the source code is quite inconvenient. Therefore, the page is stored as a standard HTML file and split during compilation into segments of static text separated by function calls that produce dynamic content. The result is saved in app_webserver_template.h, which is then included in app_webserver.c. This allows the dynamic HTML to be generated as efficiently as possible.
MQTT in this project is used for more than just sending current measurements. After connecting, the device also publishes its availability status and Home Assistant autodiscovery messages. Thanks to this, entities for CO2, temperature, humidity, and Wi-Fi signal strength automatically appear in Home Assistant without needing to manually define them in YAML.

When network parameters are updated in the settings, the MQTT client can be re-instantiated with the new broker address, login, password, and client IDs. Thus, the web server manages not only the stored settings but also the behavior of the active network stack.
| Component / Material | Model / Description | Purpose in the Project | Estimated Cost |
|---|---|---|---|
| Microcontroller | ESP32-C3 development board | Logic, Wi-Fi Provisioning over BLE, MQTT, and web server. | ~$3 |
| Sensirion SCD41 (or SCD40) | Photoacoustic sensor for carbon dioxide, temperature, and humidity (I2C). | ~$25 | |
| Display | Round screen (SPI) | Interface rendering and smooth animations via the dgx graphics library. |
~$4 |
| Interface | Touch button TTP223 | The sole control element (single/double tap, hold). | ~$0.2 |
| Main Enclosure + Back Cover | 3D print (37.5g + 10.5g transparent + 2.5g black plastic) | Original custom design. | ~$1 total |
Total: roughly $35. Considering the MQTT and HA integration, this is significantly less expensive than alternative off-the-shelf options on the market.
Designing the enclosure turned out to be a whole adventure of its own. It was crucial to isolate the sensor from the rest of the electronics inside the casing, ensure adequate air access to the sensor, and, of course, make it look good.
Since my primary workstation at home runs Linux, I didn't have many options for CAD software. However, I kept seeing FreeCAD videos on YouTube, so I decided to learn it. I had never done any 3D modeling before, let alone for 3D printing. I had to learn many techniques, searching for answers on Google and YouTube. While the end result can likely still be refined, I have already accounted for many small details and printed several intermediate prototypes.
For printing, I chose clear PETG. I found it very visually appealing.
To start, I tried printing just the front piece to make sure the display fit well. Despite measuring all the dimensions with a caliper, it still took several attempts to dial in the exact parameters. 3D printing has its own specific quirks.

An early test print of the front enclosure part from the inside.

An early test print of the front enclosure part from the outside.

Verifying the seating: fitting the display module from the back of the front cover.

Front view after adjusting the display seating.
Next, I focused on the outer walls and the parts that attach to them. The sensor chamber is partitioned off from the rest of the case: it needs air circulation from outside while minimizing heat transfer from the internals so that heat from the board or display doesn't distort the measurements. The sensor performs auto-corrections based on the air temperature, making this a critical parameter.

Enclosure walls.
While working in FreeCAD, I was constantly looking up how to model what I needed. I had to rely on Google, YouTube, and Claude for advice. Interestingly, YouTube tutorials often cover modeling without considering the subsequent 3D printing stage, which has its own strict limitations.
Afterwards, I modeled the full enclosure and the back cover.

Enclosure with back cover and ventilation holes for the sensor.
I decided to emboss a title on it. Unfortunately, FreeCAD cannot easily wrap text along an arbitrary curve. I had to write a Python script to arrange the letters in a circle around the display.
The first run did not turn out well. The text was highly distorted. From what I gathered, the font features were simply too thin to print cleanly with a 0.4mm nozzle.

Distorted lettering text.
The solution was to change the wall rendering method in the slicer to Arachne.
For the back cover, I went with snap-join tabs. To ensure the display is pressed firmly against the front cover, I added retention pillars on the back cover that press directly against the display.

Enclosure with the cover snapped in place.

It turned out great!
The initial layout used to measure the required wire lengths:

After all these experiments, the FreeCAD model became corrupted, and I didn't know how to repair it. It turned out I had deleted some features that other parts relied upon. Unable to restore it cleanly, I rebuilt the entire model from scratch. This gave me an opportunity to make the walls slightly sturdier, increase the depth by 5 mm, and redesign the air vents.
By default, 3D slicing uses a Grid infill pattern, which does not look very nice in transparent filament. For the final print, I switched to the Gyroid pattern.


Pressing the touch button lights up a red LED. Thanks to the transparent plastic, it is immediately clear that "the button has been pressed."

Due to the wires running to the button and sensor on one side, I had to offset the display support guides slightly from the center. This did not cause any noticeable issues.

Gyroid definitely looks much better than Grid.


Small video:
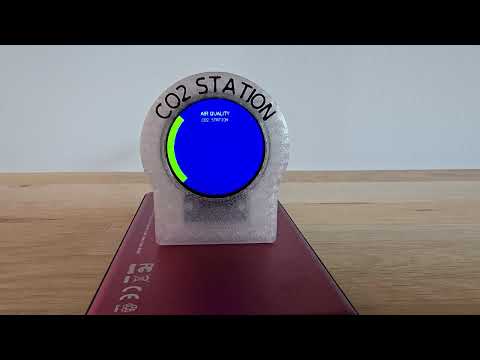
Startup and Operation.
The experiment of creating a custom enclosure, integrating it with Home Assistant, and monitoring air quality in general has been completed. I have gained many new skills in designing enclosures for such devices. A home air quality monitor is now up and running. My wife mentioned that we need to make two more to monitor the air quality in the kids' rooms.