High-dimensional NLP classification pipeline for approximately 198K noisy user-generated comments under a severe 21:1 class imbalance ratio, using TF-IDF representations, feature engineering, and class-imbalance-aware modelling.


-brightgreen)


This project was developed as part of the Machine Learning Practice (MLP) Project course under the BS in Data Science and Applications programme at IIT Madras, independently executed using the Comment Category Prediction Challenge on Kaggle as the problem statement.
- Public Leaderboard Score: Macro F1 — 0.8344 (Top 5% on Kaggle Public Leaderboard)
- Academic Score: 96/100 (S Grade)
The project focused not only on leaderboard performance, but also on understanding representation trade-offs, class-imbalance behaviour, and model generalisation in sparse NLP settings.
Having completed foundational coursework in ML algorithms, this project was an opportunity to apply that theory end-to-end — building a full pipeline with Scikit-learn, LightGBM, Pandas, NumPy, Matplotlib, and Seaborn on a real problem with real constraints.
This project explores multiclass classification of noisy user-generated comments under severe class imbalance in a sparse high-dimensional NLP setting.
The objective was not only to achieve strong predictive performance, but also to study how different text representations, feature transformations, and model families behave in sparse high-dimensional NLP settings.
The pipeline includes:
- Exploratory data analysis and linguistic pattern analysis
- Numerical and text-based feature engineering
- Sparse text representation using word-level and character-level TF-IDF
- Transformation and selection of skewed features
- Systematic comparison of linear and boosting-based models
- Evaluation focused on class imbalance using Macro F1 and Precision-Recall analysis
Raw Comments + Metadata
           ↓
EDA & Text Analysis
           ↓
Feature Engineering
           ↓
TFIDF + Engineered Features
           ↓
High-Dimensional Sparse Matrix
           ↓
Model Training & Tuning
           ↓
Evaluation & Interpretation
The dataset contained 198,000 comments across 14 features, including engagement signals (upvote, downvote, emoticon counts), automated system indicators (if_1, if_2), demographic metadata (race, religion, gender), and the raw comment text.
Several practical NLP challenges were present:
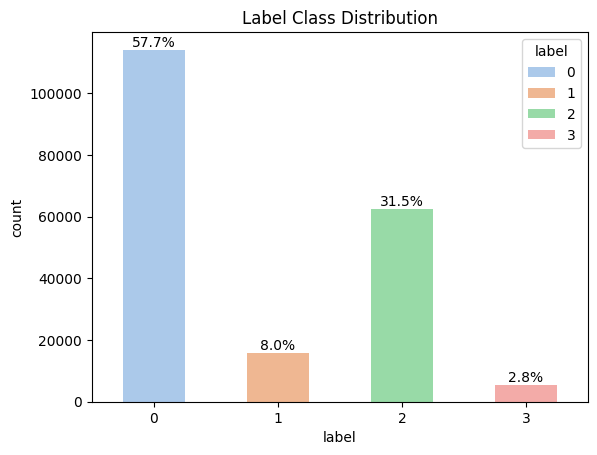
- Significant class imbalance across target categories (~21:1 class imbalance ratio)
- Informal and noisy user-generated text
- Zero-inflated and heavily skewed numerical metadata features
- Minority-class sensitivity under Macro F1 evaluation
- Overlapping linguistic patterns between semantically similar classes
The target had four classes with no provided descriptions. Text analysis during EDA revealed their likely nature:
| Class | Observed Behaviour |
|---|---|
| 0 | Relatively neutral language and factual discussion |
| 1 | Hateful and discriminatory language; minority class with strong demographic signal |
| 2 | Ambiguous vocabulary with overlap across other classes; majority class |
| 3 | Violent and offensive expressions; smallest class with more distinct but rare patterns |
These characterisations were derived from sampling and linguistic pattern analysis during EDA, not provided as part of the competition.
These constraints made the project particularly useful for studying trade-offs between feature engineering, sparse text representations, and model behaviour under imbalance.
The primary goals of the project were:
- Accurately classify comments into predefined categories
- Build representations robust to noisy and inconsistent text
- Maintain strong generalisation under leaderboard evaluation
EDA was used not only for descriptive analysis, but to guide downstream feature engineering and modelling decisions.
Missing Value Strategy
The race, religion, and gender columns each contained approximately 73% missing values. Three approaches were considered:
- Dropping rows — not viable at 73% missingness without severe data loss
- Imputing from existing categories — would introduce distributional bias since the true distribution of missing entries was unknown
- Creating a separate "Missing" category — selected, as it preserves the absence of demographic information as a signal in itself
The single missing value in the comment column was dropped safely.
The post_id column was investigated separately where comments within the same thread still had different labels, meaning thread identity carried no predictive signal and the column was dropped.
The dataset exhibited a 21:1 imbalance ratio between the majority and minority classes, creating significant challenges for minority-class recall and stable Macro F1 optimisation.
This imbalance motivated:
- Macro F1 as the primary evaluation metric
- Class-weight-aware optimisation
- Precision-Recall analysis instead of ROC-based evaluation
Standard remedies such as oversampling and undersampling were considered but rejected: undersampling would cause significant information loss at 198K rows, while oversampling risked introducing duplicate samples and artificially inflating the training distribution. Class-weight penalisation was used instead.
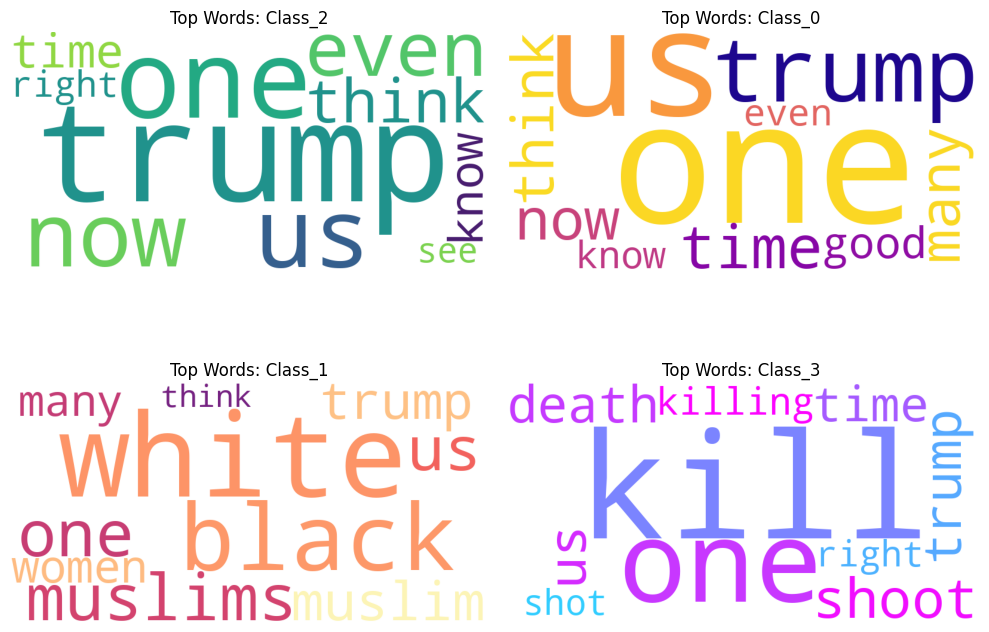
Class-wise text analysis revealed distinct lexical and structural patterns across categories:
- Class 0 reflected relatively neutral language with factual discussion patterns
- Class 1 contained hateful and discriminatory language with strong demographic keyword associations
- Class 2 showed significant vocabulary overlap with other classes, making it the most overlap-prone class
- Class 3 contained violent and offensive expressions with more distinct but rare vocabulary patterns
Temporal analysis suggested cyclic activity patterns across comments. To preserve periodic relationships without introducing artificial ordinal assumptions, hour and month features were encoded using sine-cosine transformations.
Several numerical features showed strong skewness, heavy zero inflation, and long-tailed distributions.
Among numerical features, if_2 showed the most noticeable median differences across classes, suggesting stronger predictive signal compared to features like upvote, downvote, and emoticon counts, which showed heavy IQR overlap across all classes.
Categorical features (race, religion, gender) showed a disproportionately strong association with Class 1 despite it being a minority class which was an early signal that demographic context was a meaningful predictor for that specific category.
These observations motivated:
- Yeo-Johnson transformation for skew reduction
- Binary indicator conversion for zero-inflated variables
- Mutual-information-based comparison of raw vs transformed features
Mutual Information analysis later confirmed many patterns identified during EDA. Features associated with comment length, vocabulary structure, temporal activity patterns, and character-level token variation showed meaningful predictive contribution across several categories.
This alignment between exploratory observations and downstream feature importance provided additional confidence that the engineered features were capturing genuine class-specific behaviour rather than noise.
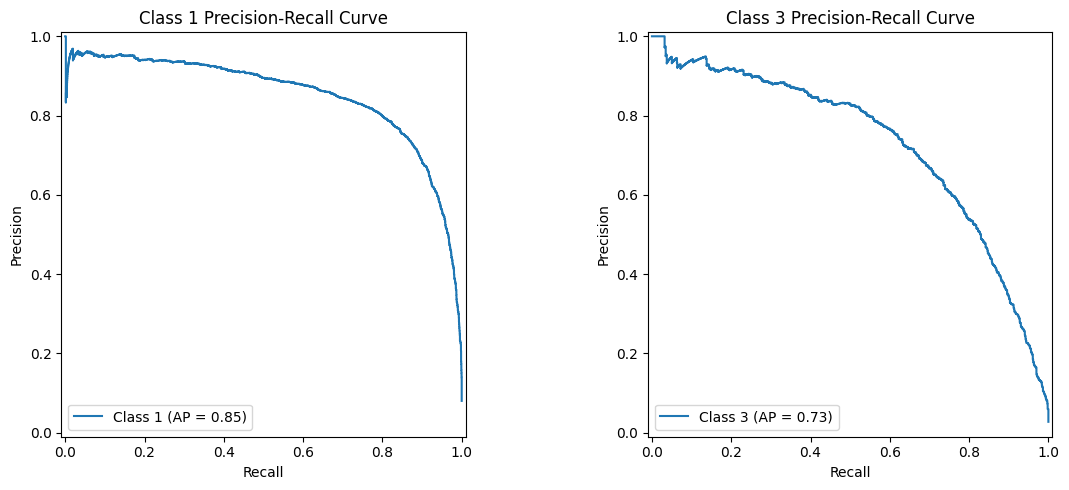
Precision-Recall curves are shown for Class 1 and Class 3 for the LightGBM model. These classes were selected because they represent the two hardest minority-class problems in this pipeline as Class 1 due to its strong but narrow demographic signal, and Class 3 due to its small sample size and inconsistent phrasing patterns. ROC curves were intentionally not used; see Evaluation Strategy for reasoning.
Feature engineering played a central role in improving model performance.
The following features were created from the raw data:
- Comment length — character count of the comment
- Word count — number of words in the comment
- Average word length — derived from comment length ÷ word count, capturing whether comments use simpler or more complex vocabulary
- Hour, month, year — extracted from the comment timestamp
disability— boolean column converted to numeric binary (0/1) for pipeline compatibility
Comment length and word count showed strong positive correlation (both derived from the same source), which was noted but accepted as both carried complementary structural signals.
Hour and month features were cyclically encoded using sine-cosine transformations. This preserved periodic relationships that would otherwise be distorted under standard ordinal encoding.
Features such as emoticon counts, if_1, and downvote were heavily zero-inflated. Instead of treating them purely as continuous features, binary indicators were introduced to explicitly model feature presence versus absence, reducing skewness and allowing models to learn meaningful patterns.
Two transformation strategies were evaluated on features such as upvote, if_2, average word length, and word count:
- Log transformation
- Yeo-Johnson transformation
Yeo-Johnson consistently reduced skewness more effectively while remaining stable for zero and negative values, and was therefore retained.
Mutual Information (MI) was used to evaluate feature relevance across both raw and transformed feature sets.
- Raw features pipeline — cross-validated Macro F1: 0.6127
- Transformed features pipeline — cross-validated Macro F1: 0.6182
The transformed feature set marginally outperformed and was selected for the final pipeline. TF-IDF features were excluded from MI selection due to their high dimensionality and sparse nature, which can produce unstable importance estimates.
The final representation combined word-level TF-IDF, character-level TF-IDF (char_wb), and engineered numerical features.
Word-level vectorisation was used to capture semantic patterns, contextual word relationships, and class-specific vocabulary usage. Hyperparameters including ngram_range, min_df, max_df, and sublinear_tf were systematically tuned.
Character-level TF-IDF improved robustness against informal language, misspellings, morphological variation, and noisy user-generated text. This representation was particularly helpful for minority classes with inconsistent phrasing patterns.
The final tuned feature space contained approximately 125K sparse TF-IDF features, combining word-level and character-level representations with tuned vocabulary limits.
Truncated SVD was intentionally not applied. SVD captures global variance across the feature space, which risks diluting the rare but class-specific signals that minority classes (particularly Class 1 and Class 3) depend on. Preserving the full sparse representation was considered more important than reducing dimensionality.
Three model families were explored to compare behaviour under sparse high-dimensional NLP representations.
Used as a strong linear baseline with regularisation tuning (C: [0.01, 0.1, 1, 10]), tolerance optimisation, and class-weight balancing.
Evaluated for its strong performance on sparse text representations, with hyperparameter focus on regularisation strength (C: [0.01, 0.1, 1]) and class-weight adjustments.
Manually tuned across 5 parameter combinations, exploring:
| Parameter | Values Explored |
|---|---|
num_leaves |
50, 100, 150 |
learning_rate |
0.05, 0.1 |
n_estimators |
300, 500 |
min_child_samples |
20, 50 |
class_weight |
balanced vs manual weights |
The full per-run scores for all 5 combinations are documented in the notebook. Manual tuning was chosen over grid search given the high dimensionality and sparse input — exhaustive search was computationally infeasible at this feature scale.
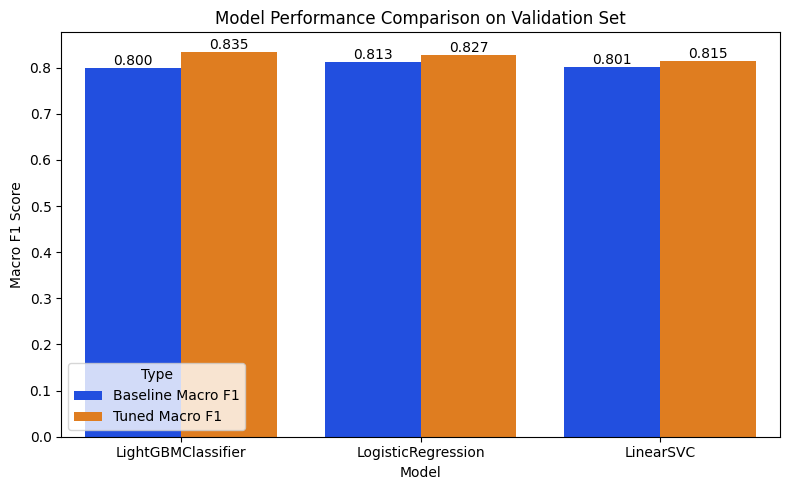
| Model | Validation Macro F1 | Leaderboard Macro F1 | Strengths | Limitations |
|---|---|---|---|---|
| Logistic Regression | 0.8273 | 0.8243 | Stable baseline, interpretable | Limited nonlinear learning |
| LinearSVC | 0.8151 | 0.8181 | Strong sparse-feature performance | Reduced probability interpretability |
| LightGBM | 0.8353 | 0.8344 | Captured nonlinear interactions | Greater overfitting sensitivity |
LightGBM achieved the best overall Macro F1 (+0.008 over Logistic Regression on validation) by leveraging both engineered numerical features and nonlinear interactions.
Slight overfitting in the final LightGBM model (train F1: 0.9777 vs val F1: 0.8353) was considered acceptable as it improved minority-class recall while the leaderboard score confirmed generalisation was maintained.
Macro F1 was selected because the dataset was highly imbalanced, equal importance was assigned to all classes, and minority-class performance needed explicit weighting.
Models were evaluated using classification reports, confusion matrices, and Precision-Recall curves. Class-wise feature importance plots were examined after each tuned model run to verify that learned coefficients aligned with EDA-derived class characterisations.
ROC curves were intentionally not prioritised because the large number of true negatives in imbalanced settings can produce overly optimistic interpretations. Precision-Recall analysis provided more informative insight into minority-class behaviour and precision-recall trade-offs.
| Stage | Macro F1 |
|---|---|
| Raw TF-IDF baseline (Logistic Regression) | 0.7968 |
| + Feature engineering | 0.8137 |
| + Hyperparameter tuning | 0.8273 |
+ char_wb TF-IDF + LightGBM (final) |
0.8353 |
Macro F1: 0.8344 (Top 5% on public leaderboard)
The close alignment between validation (0.8353) and leaderboard (0.8344) scores confirmed the pipeline generalised reliably. The progression table above shows that feature engineering contributed more to the final score than switching model families.
Class 3 (violent/offensive) showed the lowest Average Precision across all three models:
| Model | Class 1 AP | Class 3 AP |
|---|---|---|
| Logistic Regression | 0.84 | 0.71 |
| LinearSVC | 0.80 | 0.65 |
| LightGBM | 0.85 | 0.73 |
The consistency of this gap across all three model families suggests a data and representation problem rather than a modelling limitation.
Class 2 had the highest absolute misclassification volume, bleeding primarily into Class 0. This was already visible in the class-wise feature importance plots — Class 2 shared its top-weighted tokens almost entirely with Class 0, meaning the two classes were not well-separated at the vocabulary level. A dedicated PR curve and confusion matrix breakdown for Class 2 remains the most important unfinished piece of this analysis.
Character-level TF-IDF (char_wb) proved especially effective for handling informal language and misspellings, while engineered numerical features provided complementary structural signals.
- Feature engineering contributed more to overall performance than model selection — the pipeline gained +0.017 Macro F1 from engineering alone vs +0.008 from switching to LightGBM
- Character-level TF-IDF (
char_wb) improved robustness against noisy, inconsistent minority-class text in ways word-level TF-IDF could not - Sparse linear models (Logistic Regression, LinearSVC) remained highly competitive despite the availability of more complex nonlinear approaches
- Evaluation metric selection significantly shaped the optimisation strategy — Macro F1 forced minority-class sensitivity that accuracy would have ignored
- Mutual Information analysis confirmed EDA patterns, improving confidence that engineered features captured genuine class signals rather than noise
- Incremental feature improvements produced larger gains than aggressively increasing model complexity — a consistent finding across all pipeline stages
.
├── 23f2005144-comment-classification-notebook.ipynb  # Full pipeline: EDA → feature engineering → modelling → submission
├── Class Distribution.png                            # Bar chart of class frequencies; 21:1 imbalance ratio
├── Class Wise Wordclouds.png                         # Per-class word clouds from EDA text analysis
├── Model Performance Comparison.png                  # Validation Macro F1 across all 3 models
├── PR Curves Minority Classes.png                    # Precision-Recall curves for Class 1 and Class 3 (LightGBM)
├── README.md                                         # This file
├── requirements.txt                                  # Pinned dependencies
└── submission.csv                                    # Final LightGBM predictions (run 4, val Macro F1: 0.8353)
The dataset is sourced from the Kaggle competition and cannot be redistributed here.
To run the project:
- Download
train.csvandtest.csvfrom the competition data page - Place them in the root directory alongside the notebook
- Install dependencies and run:
pip install -r requirements.txt
jupyter notebook 23f2005144-comment-classification-notebook.ipynb| Category | Tools |
|---|---|
| Core Language | Python |
| Machine Learning | Scikit-learn, LightGBM |
| Data Handling | Pandas, NumPy |
| Visualization | Matplotlib, Seaborn, WordCloud |
| NLP / Text Processing | TF-IDF, Regex |
| Statistical Transformations | SciPy |
- Engineering additional engagement-based features (e.g. interaction signals, user activity patterns) to improve class separability
- Targeted error analysis on Class 2 and Class 3, where Class 2's confusion with Class 0 was the largest source of cross-class errors but was not explored with PR curves or threshold analysis; Class 3's low AP was consistent across all models suggesting a data problem rather than a modelling one. Both warrant a dedicated held-out error audit.
- Ensemble combinations of linear and boosting models, specifically a soft-voting ensemble of LinearSVC probability estimates and LightGBM leaf scores, weighted to favour LinearSVC's sparse-feature precision for minority classes. The goal would be to improve Class 3 recall without degrading Class 0 precision, since the two model families make different errors on the same samples.
The notebook is structured sequentially and mirrors this README:
| Section | Contents |
|---|---|
| EDA | Data overview, missing value handling, class distribution, text analysis, uni/bi/multivariate analysis |
| Feature Engineering | Binary indicators, sine-cosine encoding, skew transformations, MI comparison |
| Text Representation | TF-IDF word + char_wb tuning, feature space construction |
| Modelling | Baseline → tuned runs for all 3 models, with classification reports, confusion matrices, PR curves, and feature importance plots |
| Submission | Final model retrained on full data, all 3 submission scores documented |
The emphasis throughout is on data-driven decision-making where each engineering and modelling choice is motivated by a preceding observation.