How to make a Minerva Story?
Minerva Author is the tool for annotating (through the process of authoring) large image data to create a Minerva Story. Authoring a Minerva Story involves looking at the data and creating a series of waypoints and accompanying text that directs viewers to areas of interest. The author (you) selects groups of markers (AKA channel groups) for each waypoint and may also choose to include data visualization charts to further describe the data. Watch this short video before following the step-by-step instructions below to download, install, and use Minerva Author to create a story describing your image data.
- The file path to your OME-TIFF or SVS image.
- All OME-TIFF channels must be 16-bit integers, as output by the mcmicro pipeline, or unsigned 8-bit integers.
- Here's an example OME-TIFF.
- The file path to a CSV file with marker names, if marker names are not in the OME-XML metadata.
- Here’s an example CSV file with the correct “marker_names” header.
-
Optionally, to create data visualization charts:
- CSV files matching the formats specified for data visualizations.
- Here are three example CSV files: scatterplot.csv, matrix.csv, and barchart.csv.
-
Optionally, to import cell state segmentation masks:
- A 32-bit TIFF or OME-TIFF segmentation image.
- A CSV file matching the format specified for cell segmentation masks.
When downloading Minerva Author, please be aware of its current technical limitations:
- Minerva Author only saves to the folder where the application is launched.
- You should close the previous Minerva Author tab before opening a new one.
- Minerva Author has been tested in Chrome and Firefox. It does not support Safari or Internet Explorer.
- All
.story.jsonfiles require linked files (.tif,.ome.tif,.svs, and.csv) not to be moved or deleted.
- Download this zip file for MacOS.
- Download this zip file for Windows.
Alternatively, click here for instructions on how to run from source code.
- Unzip the downloaded file
- Run the executable:
- On Windows, double-click on the executable file minerva_author.exe.
- On MacOS, right-click and "Open" the executable file minerva_author.
This will open a terminal on your computer and begin running the program

It will also launch the program in your default browser. If your default browser not Firefox or Chrome, copy the URL from the address bar to Chrome or Firefox.

If the program does not automatically launch, then open a browser and enter localhost:2020 into the address bar
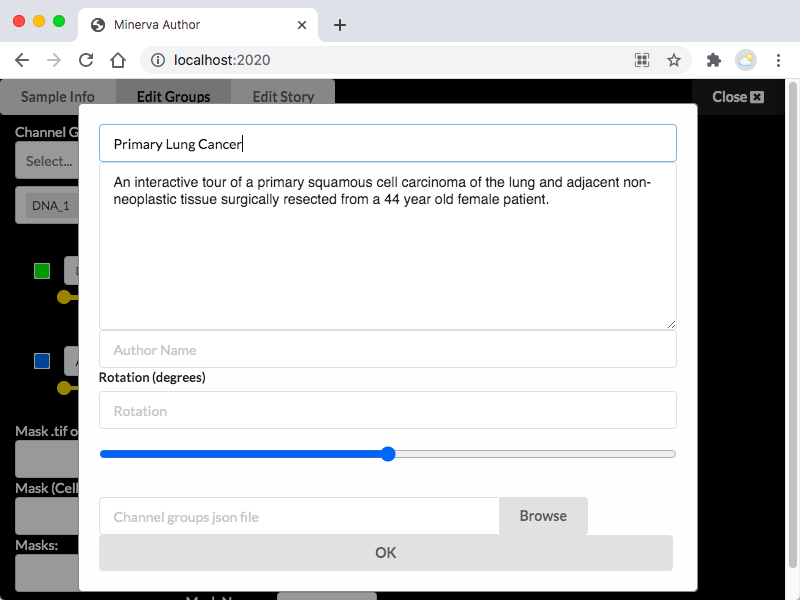
- Select the OME-TIFF file you wish to create a Minerva Story for.
This is the image you wish to create a Minerva Story for. It must be in OME-TIFF file format. Future releases of Minerva may accommodate other image file standards.
Alternatively, if you have already started authoring a story want to return to it, select the top-level .story.json file saved from the previous session.
- Enter the file path to a list of channel names
This file must be a .csv with the same format as the example.
-
Enter an output name (e.g. LUNG-3-PR) for this story. This string will be used in the output filenames. Avoid spaces and special characters. Underscores and dashes are ok.
-
Click "Import" and wait for image pyramid to be generated.
Note: The duration of this step scales with size of OME-TIFF file.


A channel group is a predefined group of image channels and rendering settings (color, contrast, etc.) that will be displayed at each waypoint of the Minerva story and that the users can toggle between.


Create as many channel groups as you would like. You can always come back to this tab to add more.
Now it's time to add narrative text and annotate the image. Select the "Edit Story" tab.

- When hosting your Minerva Story:
- A colored underline will automatically appear when the marker name in the narrative description matches a marker in the currently active “channel groups” legend.
- A link to the GeneCard will automatically appear when the marker name in the narrative description matches a marker in the “database” (two CSV files with links and aliases for cell types and markers).

Add as many waypoints as you would like. You can change the zoom, pan, and add annotations such as boxes and arrows to the image.
- Click the small white "arrow" icon on the right of the control pane to create an arrow.
- Then click anywhere on the image to place an arrow.
- Click the name of the arrow at the bottom of the control pane to rename or rotate the arrow.
- Click the small white "crosshairs" icon on the right of the control pane to make a rectangular overlay.
- Then click and drag anywhere on the image to place an overlay.

Note: If you have no data visualization charts to add, you may skip to the next step.
You should have a CSV file available with the following headings:
| clust_ID | X_position | Y_position | ** | *** |
|---|---|---|---|---|
| ... | ... | ... | ... | ... |
| ... | ... | ... | ... | ... |
| ... | ... | ... | ... | ... |
Each row should represent a specific cell, with the clust_ID column set to a positive whole number identifying the cluster assigned to each cell. The X_position and Y_position should give the position of each cell in image pixels. The remaining two columns should contain positive numerical values in each row, as they will form the X and Y position of your scatterplot.
The column headings ** and *** should be replaced with the labels for the X axis and Y axis of your scatterplot. For the below example, ** is KERATIN and *** is CD45. Using the Minerva Author UI, it is possible to assign names and colors to each of the four clusters. The below example shows the matrix plot UI in Minerva Author and the output in Minerva Story when paired with the scatterplot.csv from the Example Dataset page.
| Minerva Author | Minerva Story |
|---|---|
 |
 |
You should have a CSV file available where the first heading is ClustName:
| ClustName | ** | *** | **** | ***** | ****** |
|---|---|---|---|---|---|
| ... | ... | ... | ... | ... | ... |
| ... | ... | ... | ... | ... | ... |
| ... | ... | ... | ... | ... | ... |
The number of additional headings marked **, ***, ... ****** determines the number of columns in your matrix plot. Typically, the headings should match marker names in your dataset. The number of rows in the CSV file determines the number of rows in your matrix plot. Typically, the names in the ClustName column should match clusters of cells in your dataset. The remaining values should be normalized numerical averages of marker intensity for each given cluster. The below example shows the matrix plot UI in Minerva Author and the output in Minerva Story when paired with the matrix.csv from the Example Dataset page.
| Minerva Author | Minerva Story |
|---|---|
 |
 |
You should have a CSV file available with the headings type and frequency:
| type | frequency |
|---|---|
| ... | ... |
| ... | ... |
| ... | ... |
Typically, the names in the type column should match clusters of cells in your dataset. The values in the frequency column should be numerical cell counts for each given cluster. The below example shows the bar chart UI in Minerva Author and the output in Minerva Story when paired with the barchart.csv from the Example Dataset page.
| Minerva Author | Minerva Story |
|---|---|
 |
 |
Note: If you have no cell segmentation masks, you may skip to the next step.
From the "Edit Groups" tab, you will see the empty mask interface if you have not yet added cell segmentation masks to your story using Minerva Author:

Use the first field to select a path to a cell segmentation image in either OME-TIFF or TIFF format. If you select a TIFF file, you will need to wait for Minerva Author to convert that file to an OME-TIFF. Minerva Author will save the OME-TIFF in the same directory as the selected TIFF. After the mask image has loaded, your mask interface should look like this:

At any time, you may use the second field to select a "cell states" CSV file with two columns with CellID and State as the column headers. Each row should have a positive whole number for the CellID column and a text label in the State column. Minerva Author uses this file to create a separate cell mask for each unique state.
| CellID | State |
|---|---|
| ... | ... |
| ... | ... |
| ... | ... |
After the "cell states" CSV file loads, you can change the color and label for each cell state. Your mask interface should look something like this:

Now, if you open the "Edit Story" tab, each waypoint will have a dropdown menu that allows you to select an arbitrary number of cell states for the waypoint to display. The waypoint dropdown should look something like this:

Now, any cell segmentation masks that you select for a given waypoint will render on top of the channels in the channel group associated with that waypoint.
Periodically while writing your story, you'll want to click the "Save" button to write your story's progress to a file that can later be reopened in Minerva Author to continue writing your story.
Each time you save, Minerva Author will write to a .story.json file to store your waypoints and channel groups.
Once you have created all desired channel groups and completed authoring the waypoints, click the "Publish" button to export a Minerva Story that's ready to serve publicly. You will see the progress bar reach 100% once it is done saving.
Each time you publish, Minerva Author will write an index.html page that loads an exhibit.json to display as a Minerva Story, as well as a fully rendered image pyramid for each channel group and cell state segmentation. After you publish, you can manually edit the exhibit.json file, which follows this schema.