- Download and install conda.
- Download DrCELL
- create conda environment based on the environment.yml file
- open shell or CMD
cd /path/to/DrCELLconda env create -f environment.yml --name DrCELL
- start DrCELL
cd /path/to/DrCELLconda activate DrCELL
- open CELL in extra window
python -m drcell.scripts.startApplication "/path/to/data"
- alternatively open CELL in browser
python -m drcell.scripts.startBokehServer "/path/to/data" --port 5000- open http://localhost:5000 in a browser
- install python on your system
- install DrCELL via pip:
pip install drcell
- open CELL in extra window
drcell-app "/path/to/data"
- alternatively open CELL in browser
drcell-server "/path/to/data" --port 5000
- Import your data in the DrCELL format (take a look at the Getting Started Notebook)
- After starting the application (the first launch might take some time), you see the GUI
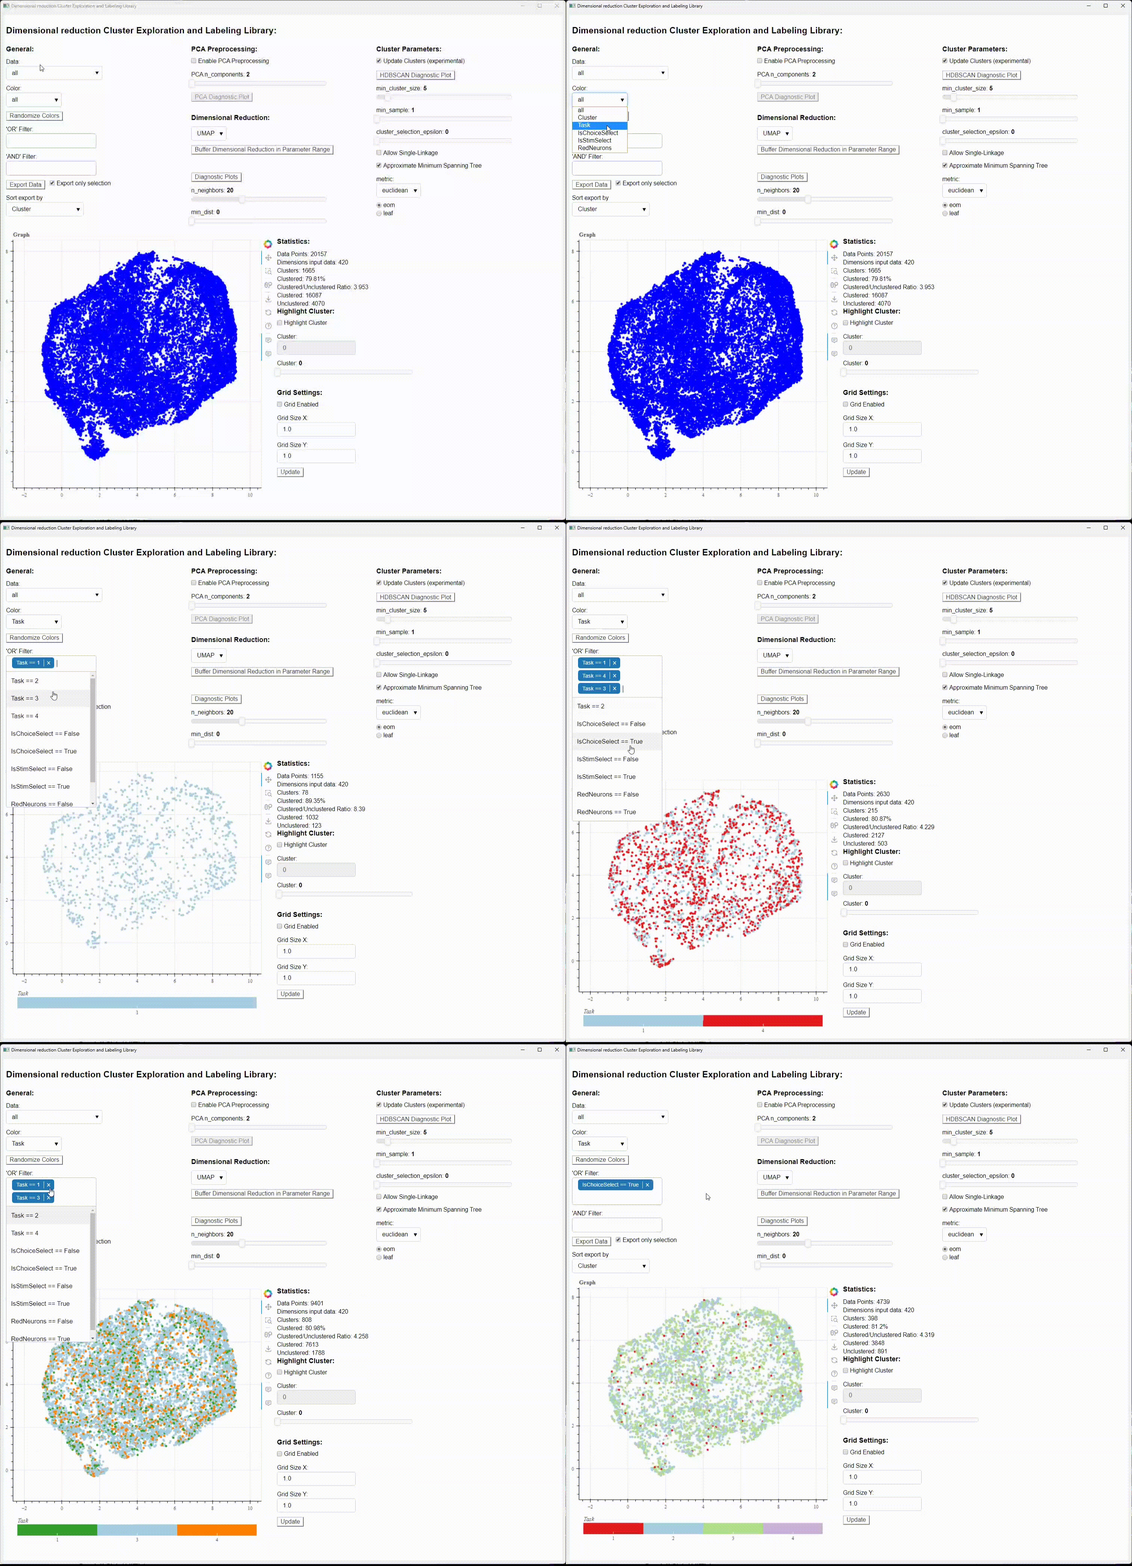
- You can select the different datasets you added in the "Data" Selection.
- With the "Color" Selection, you can select the column of your data, you want to be highlighted with color. The selectable Options can be customized with the "data_variables" in main.py
- "OR" Filter: Filters all the selected Values, by connecting them with a logical "OR". For example all red OR blue Objects. The selectable Options can be customized with the "data_variables" in main.py, and will show up with all unique values of that data column in the selection.
- "AND" Filter: Filters all the selected Values, by connecting them with a logical "AND". For example all Objects, that are red AND blue. The selectable Options can be customized with the "data_variables" in main.py, and will show up with all unique values of that data column in the selection.
- "Export Data" Button exports the current view as .npy and .mat file in the output folder. If "Export only selection" is enabled, only the data points currently on display will get exported (so for example all filtered data points won't be included). The export file can be sorted by any sortable column.
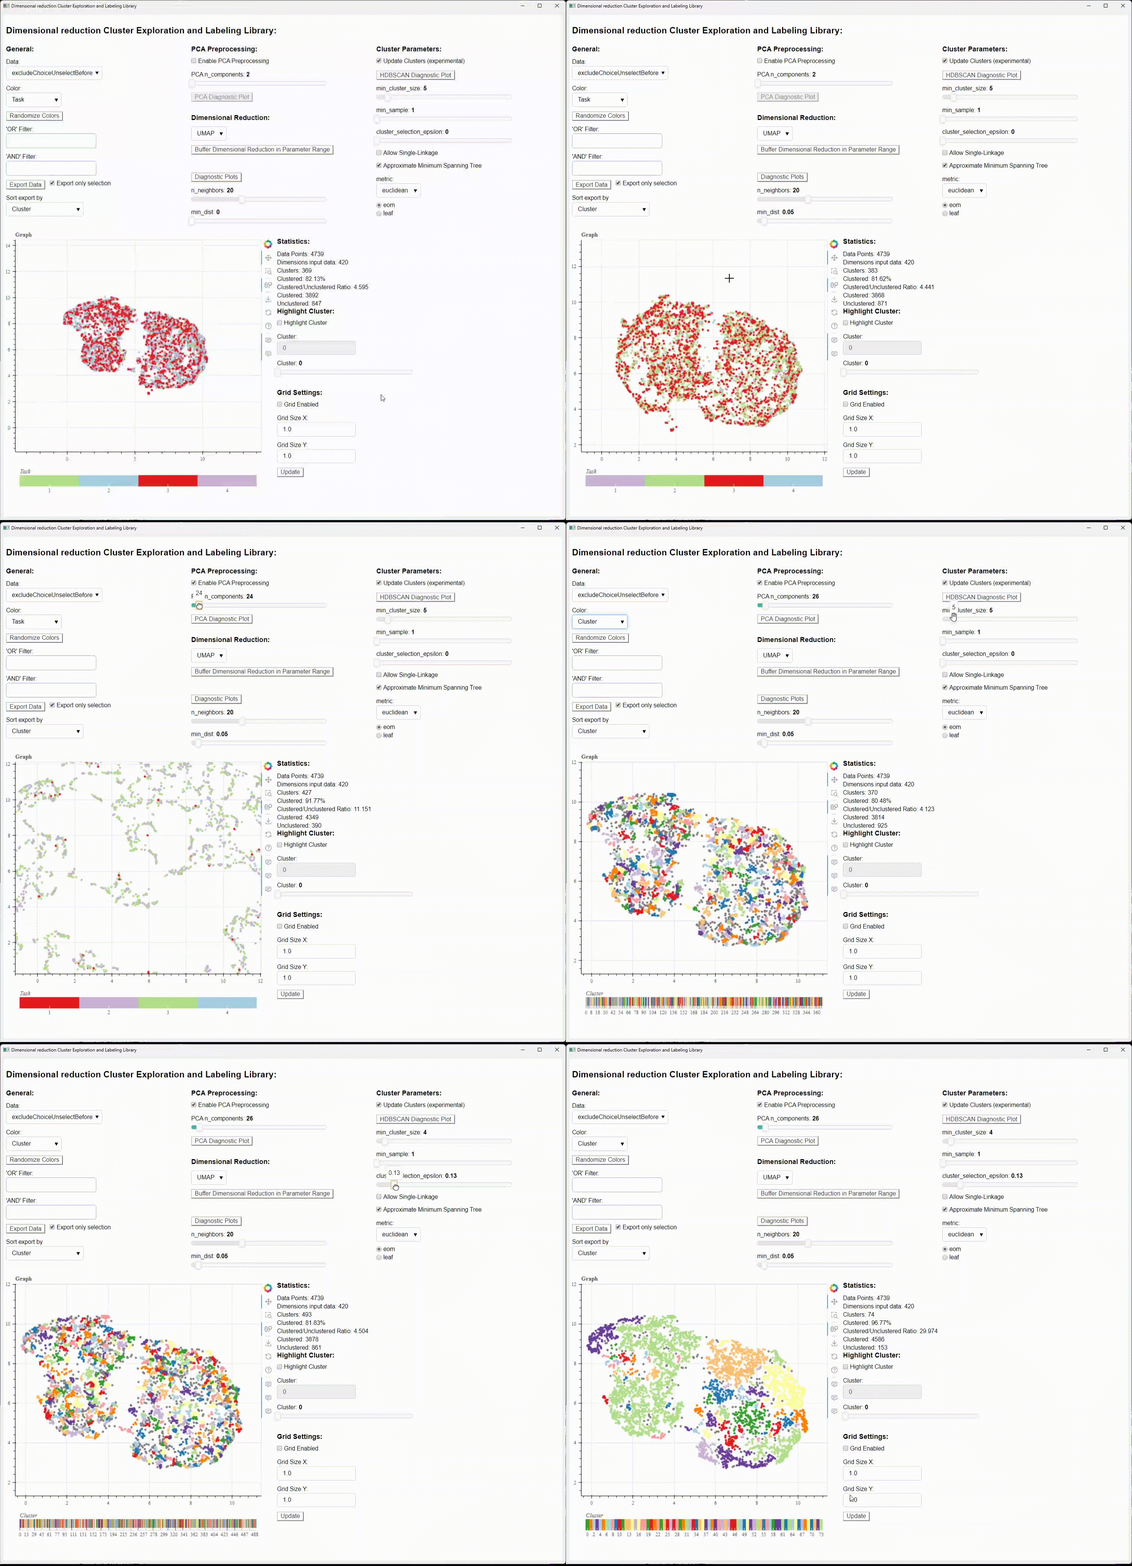
- The data can be Preprocessed via PCA. The reduction of PCA ("n_components") can be adjusted here.
- If you select "None" as Dimensionality Reduction, the PCA is restricted to 2-Dimensions.
-
Here you can change the Dimensional Reduction Method, as well as their parameters
-
By default, these dimensional reduction methods are available:
- None (uses PCA as Dimensional Reduction Method)
- UMAP
- t-SNE
- PHATE
- CEBRA (in development)
- "Update Cluster" Checkbox: When unchecking the box, the current clustering will be kept and not changed, when changing the parameters (does not include change of dataset). (in development)
- Selection of other Cluster Algorithms (potential future feature)
- HDBSCAN used as clustering algorithm
- unclustered data points get assigned to -1
- Lets you isolate a single cluster visually. Selected via entry of an integer or the slider (currently not functional)
- located on the right side of the plot
- General Tools
- Pan
- Box Zoom
- Wheel Zoom
- Save Plot
- Reset Plot Position
- Help
- Hover Tools
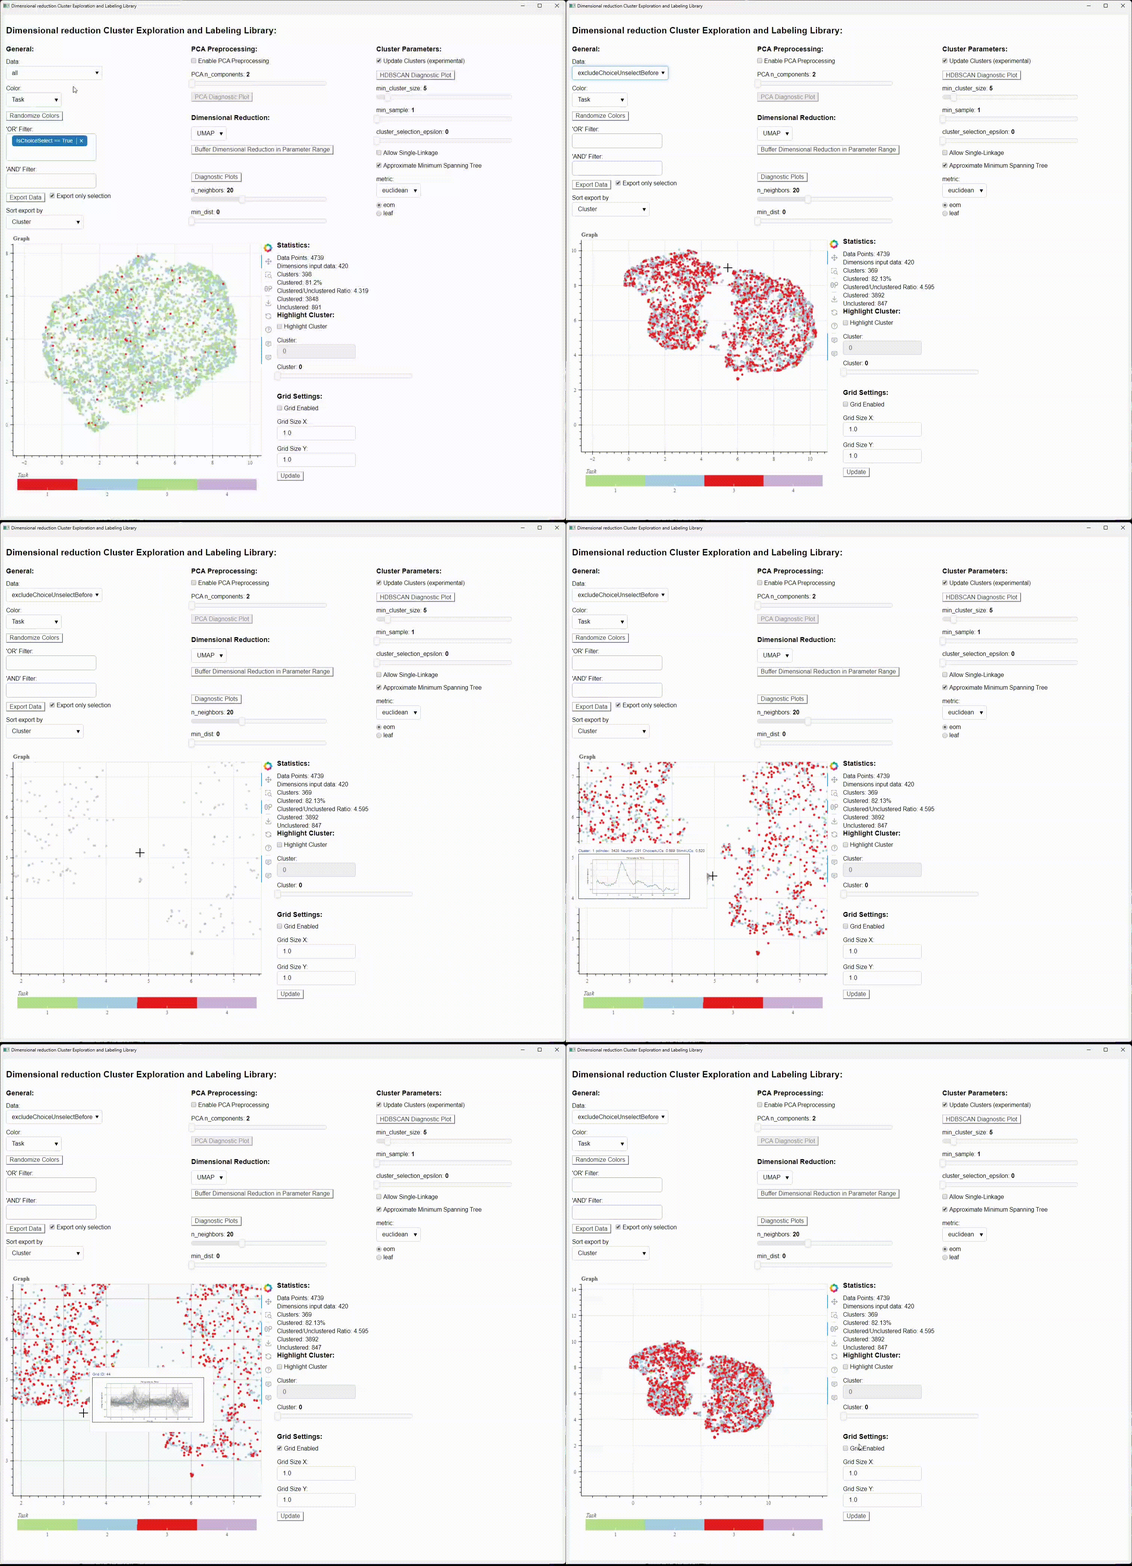
- Data point hover tool
- displays information of data point, when hovered over
- the information shown, can be customized with the "display_hover_variables" variable in main.py
- customized plot, based on data of data point (in development)
- Grid hover tool
- displays information about the quadrant and the data points in it, when hovered over it.
- customized plot, based on data of data points in quadrant (in development)
- Data point hover tool
- With this option you can enable a grid, separating your data points in quadrants, that can be hovered over with the hover tool and displays you additional information
- Some basic stats about the current selection


