Our application is a full stack mobile application written using Node.js, the ionic angular platform, and firebase. By using the ionic framework, the app can be ran on both Android and iOS.
The backend is written in Node.js and is used to gather data from the API Alpha Vantage. This data is technical indicators such as RSI and is used to determine whether or not a user should buy or sell a stock. Based on the user input of the stock name, number of candles, and RSI threshold, we can calculate from the data whether or not the stock should be sold or bought.
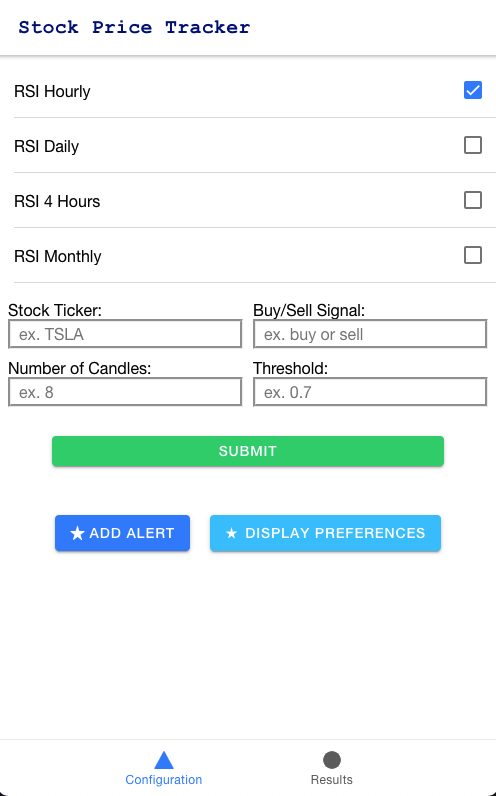
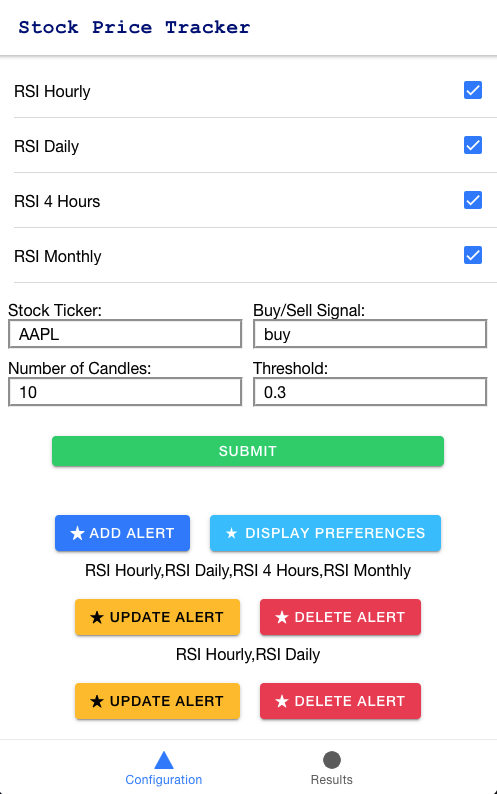
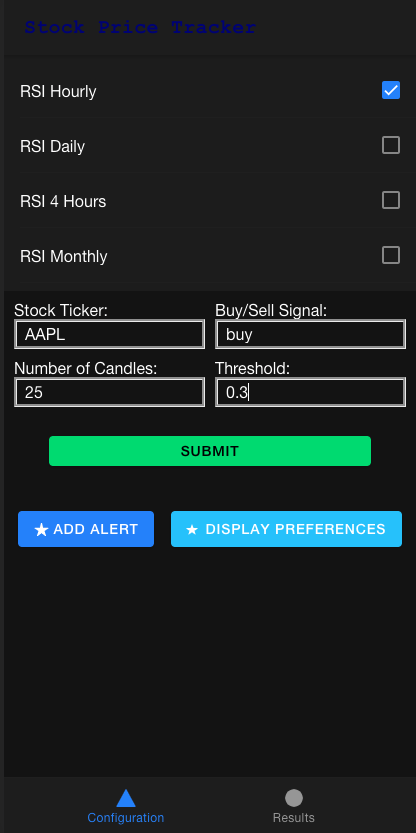
The frontend is written using the ionic framework with angular components. It allows the user to select which time frame for RSI they want to measure and add that to their alert preferences. These alert preferences are being stored in firebase. There is no set login page. Instead, the user is anonymously logged in and their user ID is stored along with their preferences. On the UI, they can add, update, and delete their RSI preferences.
Chart.js: This file contains the functionality for creating and displaying the chart on the front end. Chartjs is an NPM module and what we use to create our results graph.
Index.js: This is considered the main launching point of our backend. Index.js launches an express server using cors that will wait for a response from the front end. When the user inputs the configuration on the front end, it will pass these parameters over to index.js that will retrieve appropriate OHLC data, pass it over to the our calculation function, FindPointsWithProfit(), and then calculate the analytics behind the given points. Finally, it will return relevant data over to the front end, where it will be used to generate the results tab with a graph.
Functions.js: All of our relevant backend functions are stored in Functions.js.
getRSISignalByHour()
/** given intervaled ohlc data, this function will calculate RSI for input point (distinguished by the index)`
 * interval can either be 1 or 60 or 1440 (representing minutes)
 * @param ohlc: array
 * @param index: int index of starting point`
 * @param interval: string (1min, 15min, 30min, 60min) this is the interval at which your OHLC data jumps
 * @param buyOrSell: string ('buy' or 'sell') depending on if you want to look for buy or sell signal`
 * @param numHours: int the interval at which you would like to find RSI value
 */
getRSISignalDaily()
/** given intervaled ohlc data, this function will calculate RSI for input point (distinguished by the index)
 * interval can either be 1 or 60 or 1440 (representing minutes)`
 * @param ohlc: array
 * @param startDate: string index of starting point
 * @param buyOrSell: string ('buy' or 'sell') depending on if you want to look for buy or sell signal
 */
findPointsWithProfit()
/** given a list of indicators, this function will parse through start and end point and identify all buy/sell signals
 * and calculate to see if buying there would generate a profit and how much
 * @param indicators: array options include 'Daily', '4 hour', and '1 hour'
 * @param ohlcData: array ohlcData at datapoints every x intervals`
 * @param interval: string (1min, 15min, 30min, 60min) this is the interval at which your OHLC data jumps
 * @param numCandles: int the number of candles to look forward for profitThreshold`
 * @param profitThreshold: float the minimum profit required to make to sell your holding
 * results will be returned in an array with entries for every buy point:`
 * [
     {
       buyAt: ohlcData
       sellAt: ohlcData
       profitable: true or false
       profit: float
     }
   ]
 */

probOfProfit()
Calculates the profitability percentage given a results array returned from findPointsWithProfit
There are unit tests for the back end functionality in the test directory: Backend/test/backendtest.js. To run the tests, within the test directory, run npm test. The tests utilize a Javascript framework for Node.js programs called Mocha. This framework makes it clear to any code reader through a description of what each test does, what it expects to see as each output, and finally an assertion statement. The functions that were tested were all of the functions that were included in the functions.js file.
Within the source/app directory we have the tab angular components. The Tab1 angular component contains the main page and functionality for adding, removing, and updating alert preferences as well as inputting the stock ticker, number of candles, and RSI threshold. Tab2 contains the functionality for displaying the chart.
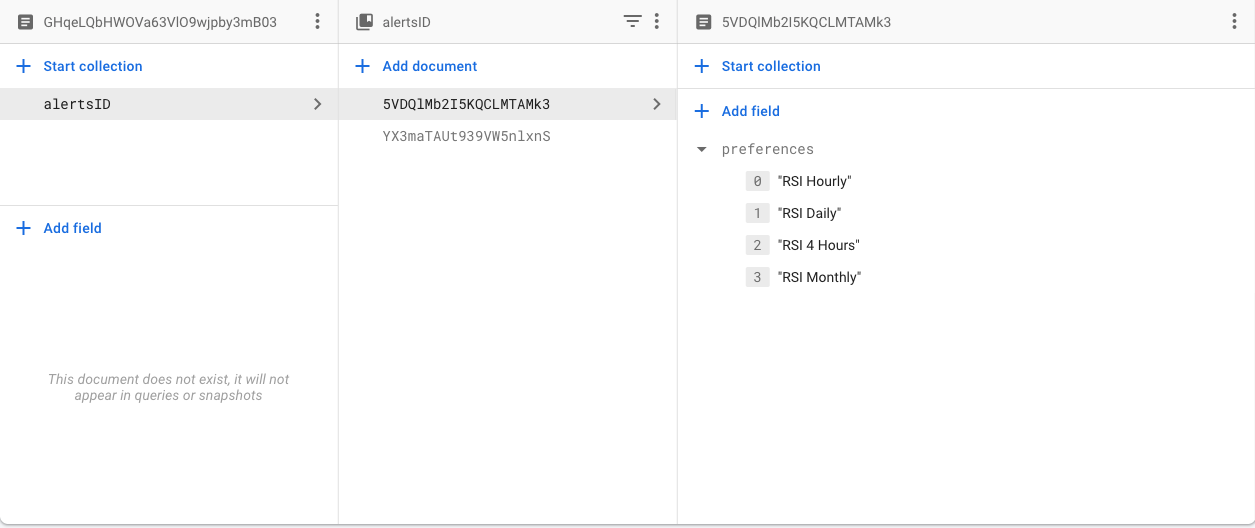
Our database is NoSQL with an alerts collection and documents storing the user id. From each user id we store the alertsID for each alert preference created as well as the alert time details.
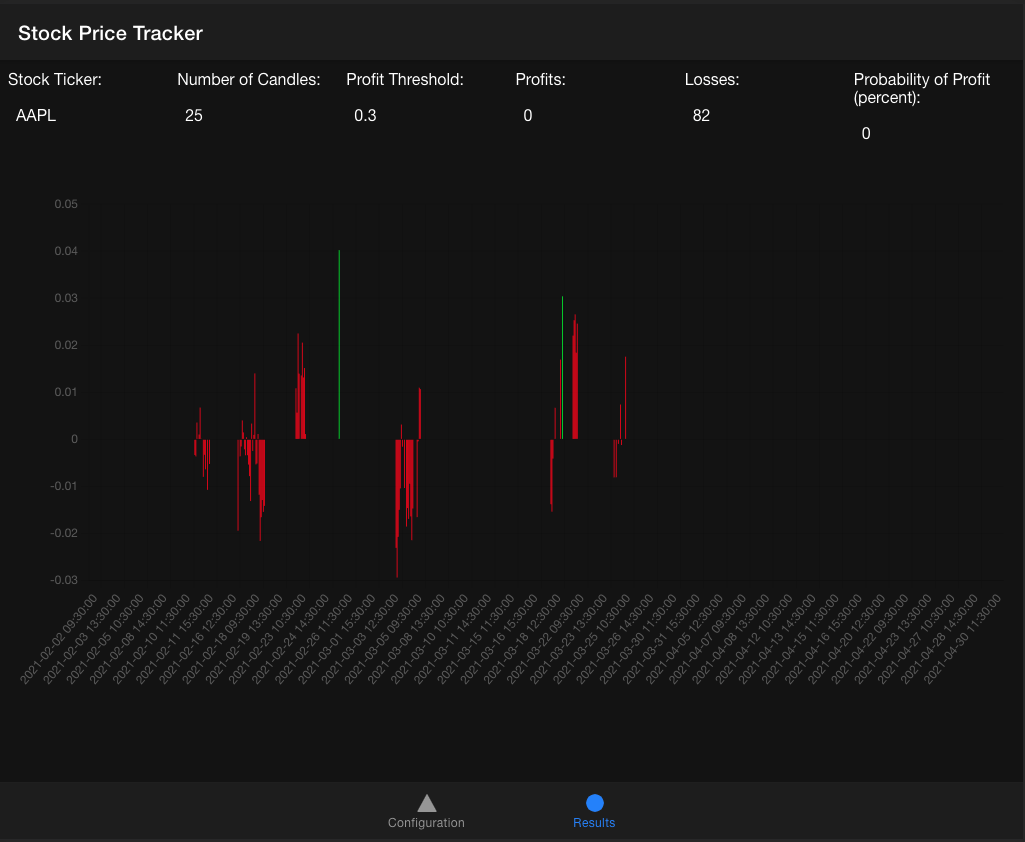
After gathering the data from the backend, we display a chart based on user inputs as follows:
In the backend folder, start up the server by running node index.js. In the frontend folder, start up ionic by running ionic serve. This should open up the ionic application locally in a browser. Now you have the application up and running!
We used github as our source control that allowed the members to work simultaneously on the project. We had different branches for the different functionalities of the project. We also integrated a code review tool, Reviewable, which allowed our Stakeholder to comment on our code and get back to us with recommendations.
By Eric Zhan, Gabriel Dalessandro, Jason Hong, John La, Malachi Schrager