The service described here has been deactivated. I have donated the code to Windy and it runs there pretty much unchanged to power the Radiosonde View - give it a try!
You can still download individual radiosonde ascents as GeoJSON from there - scroll down in the righthand radiosonde view to find the link
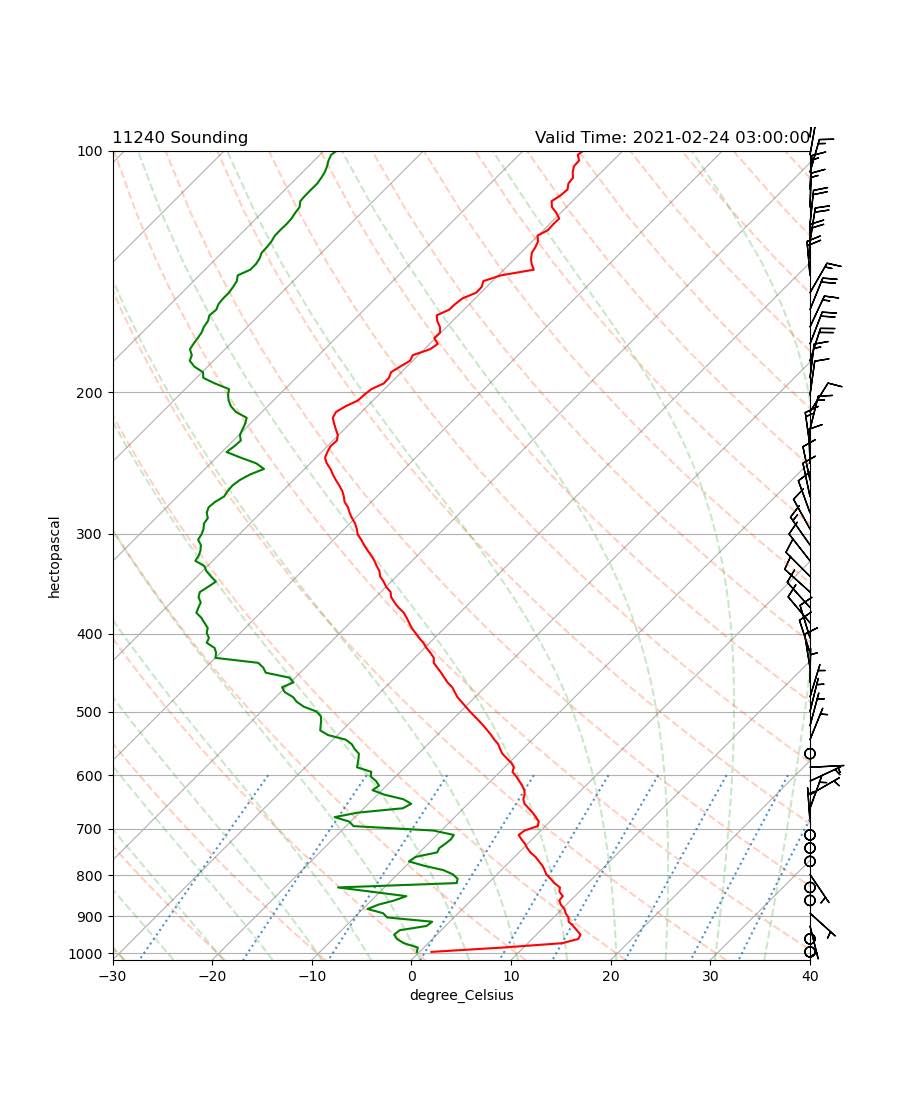
radiosonde-datacollector collates radiosonde soundings from different sources, and converts them into a web-friendly format for further use by applications such as radiosonde and https://www.npmjs.com/package/windy-plugin-radiosonde. Typical use cases include Skew-T and Stuve diagrams.
The goal is to provide global coverage for sounding data with minimum delay and fast retrieval for client web apps.
windy.com Try the radiosonde plugin by @rittels. See also here.

radiosonde is a simple Javascript application based on the venerable bootleaf code. It is not intended for general use but rather as a test vehicle for backend changes and as a display for my absolutely appalling Javascript skills.

Radiosonde data is very useful for meteo forecasting, in particular for aviation use and for correlating weather forecasts with actually measured data. However, there is no single source and access method for raw data providing global coverage, and there is no single file format for that data. radiosonde-datacollector deals with different sources, their file formats, and converts them into a single format - a compressed GeoJSON file. Here is an example from Vienna/Austria. Typical terms used for such files include sounding, "temps" (temperature sounding), or "ascent" - the latter term being used throughout this code.
Without going into the organisational intricacies of weather bureaucracies, I found several aggregators which together provide decent global coverage:
- GISC Offenbach through its Deutscher Wetterdienst open data portal service
- NOAA GTS
- GISC Moscow
- GISC Tokyo
- Meteo France
- NOAA MADIS through its MADIS service
The data is obtained through a variety of methods as there seems to be no consensus in the meteo industry. So we have: FTP pull, FTP push, HTTP pull, and HTTP push, both in anonymous and authenticated context.
There are some 2600 registered locations which provide meteorological data. Ontop, there are mobile stations like research vessels which provide soundings from varying locations. Of these, currently about 730 provide sounding data. The radiosonde-datacollector summary file currently retains 14 days of sounding data and that amounts to about 20.000 soundings - so, on average, two soundings per day and station.
All aggegators except NOAA MADIS use the more modern FM94 BUFR format which includes the flight path, and very dense samples (like every 2 seconds). The MADIS data is based on the older FM35 format wrapped into a netCDF-formatted file and has no flight path information, Also it has rather coarse vertical resolution, which varies depending on contribution organisation (sometimes within a country).
As a rule of thumb, assume 10kB per sounding (brotli-compressed geojson). So a year's worth of soundings might be 5GB.
Ths original Skew-T example uses the UofWyoming data source.
I've adapted it to use the radiosonde data source:
You need data format (fm94 or fm35), WMO station id, and date + synoptic time of the ascent. Then construct the URL like so (this example assumes format=fm94, station=11035, date 20210526 1300):
https://radiosonde.mah.priv.at/data/fm94/11/035/2021/05/11035_20210526_130000.geojson.br
All ascents are compressed using the brotli compressor. Since practically all browsers understand this format, you can drop the .br extension and just access the files like so.
The University of Wyoming runs an archive of soundings with pretty good coverage - example here. This website is also used as data source by many meteorologists, for example from Python code.
The UofWyoming service serves as a yardstick in terms of coverage and accuracy. It is interesting to note that all the aggregation and processing work behind this service is a side project by an individual researcher - we have no found any service with global coverage by any "official" provider.
The idea to use MADIS came from skewt - thanks, John!