A lightweight R-based tool for analyzing GitHub repository language statistics with automated visualization.
This project was originally part of my major research from my school work, and I decided to open source it for the community. This is also my first R project on GitHub!
You can build your own language statistics visualization by forking this repository. Welcome to star, contribute and any suggestions are welcome.
They are the examples output for my GitHub profile. For more example and formats, please check the data branch.
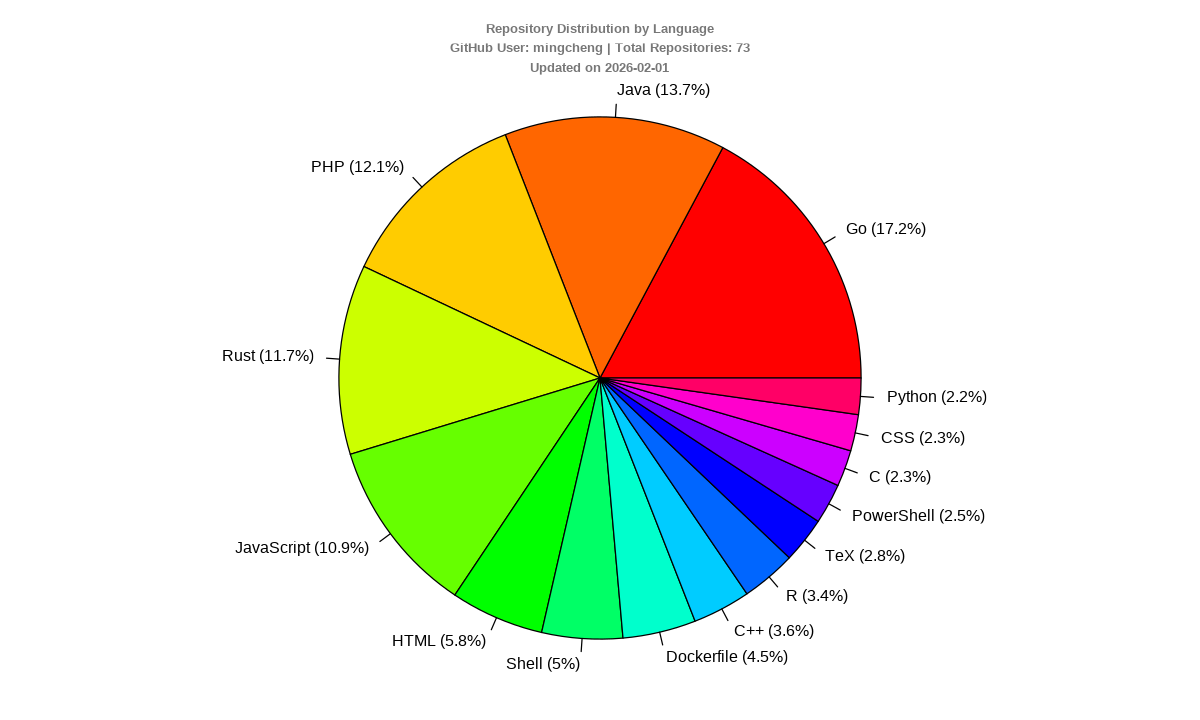
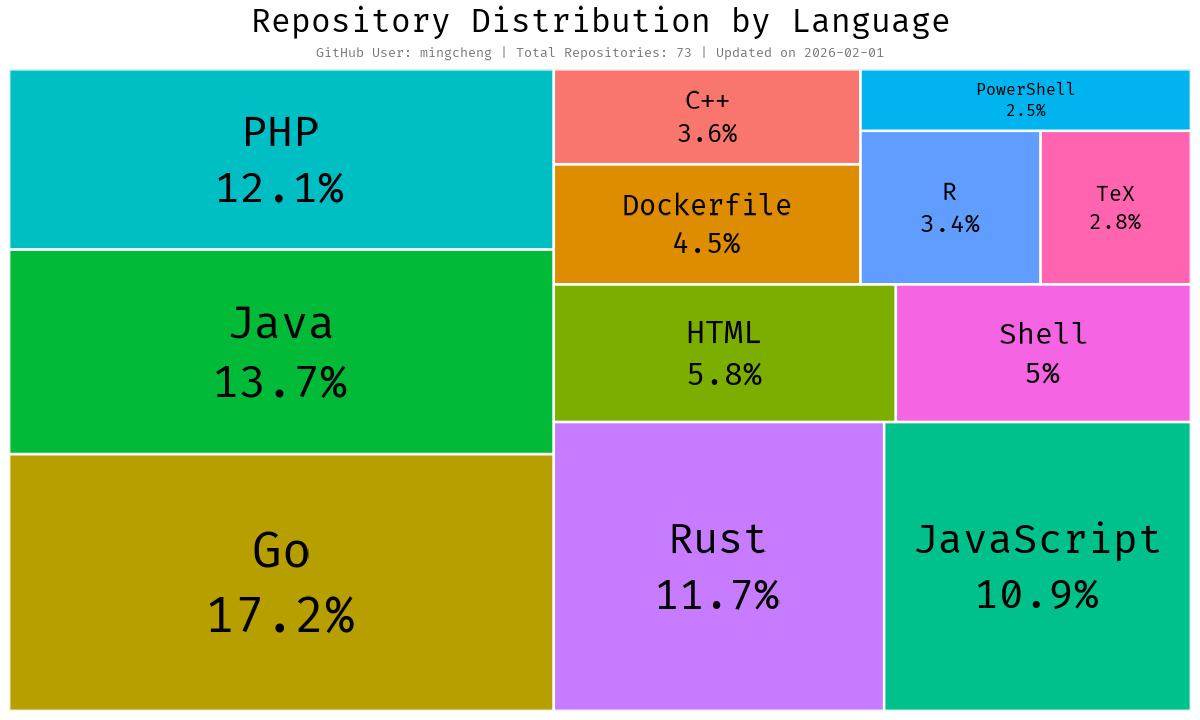
- Fetches repository data via GitHub API
- Calculates weighted language distribution based on:
- Repository update recency
- Stars and forks count
- Repository count per language
- Generates multiple visualizations, both in SVG and PNG formats:
- Pie Charts
- Treemaps
- Automated monthly updates via GitHub Actions
# Set environment variables
export GITHUB_USERNAME="your_username"

# Run analysis
Rscript R/main.RRscript tests/run_tests.RThe workflow runs automatically on the 1st of each month, or can be triggered manually via workflow dispatch. Results are committed to the data branch with the following structure:
data/{username}/
├── raw_YYYYMMDD.json       # Raw API response
├── plotted_YYYYMMDD.csv    # Statistical summary
├── piechart_YYYYMMDD.svg   # Date-stamped pie chart
├── piechart_YYYYMMDD.png
├── treemap_YYYYMMDD.svg    # Date-stamped treemap
├── treemap_YYYYMMDD.png
├── latest.svg              # Latest pie chart
├── latest.png
├── treemap_latest.svg      # Latest treemap
└── treemap_latest.png
You can link to these images in your GitHub README or personal website to showcase your language statistics. The latest.png and treemap_latest.png (or svg) files always point to the most recent visualizations.
- R >= 4 (tested on 4.5.1)
Some R packages need system libraries for HTTP, font rendering and image I/O:
sudo apt-get update
sudo apt-get install -y --no-install-recommends \
  libcurl4-openssl-dev \
  libssl-dev \
  libxml2-dev \
  libfontconfig1-dev \
  libharfbuzz-dev \
  libfribidi-dev \
  libfreetype6-dev \
  libpng-dev \
  libtiff5-dev \
  libjpeg-dev
On Windows the binary packages on CRAN include the required libraries.
On macOS, first install the Xcode Command Line Tools:
xcode-select --installThen install the required libraries via Homebrew:
brew install \
  curl-openssl \
  openssl \
  libxml2 \
  fontconfig \
  harfbuzz \
  fribidi \
  freetype \
  libpng \
  libtiff \
  jpeg
If you are using the CRAN binary R package, many of these dependencies are already bundled and only the Xcode Command Line Tools may be necessary.
Install the required R packages from CRAN:
packages <- c(
  "httr", "jsonlite", "dplyr", "showtext", "sysfonts",
  "ggplot2", "treemapify", "svglite"
)
new_packages <- packages[!(packages %in% installed.packages()[, "Package"])]
if (length(new_packages)) {
  install.packages(new_packages, repos = "https://cloud.r-project.org", dependencies = NA)
}
Or install them directly:
install.packages(
  c("httr", "jsonlite", "dplyr", "showtext", "sysfonts", "ggplot2", "treemapify", "svglite"),
  dependencies = NA
)If downloading from the default CRAN mirror is slow or fails, use a domestic CRAN mirror, for example the TUNA mirror:
install.packages(
  c("httr", "jsonlite", "dplyr", "showtext", "sysfonts", "ggplot2", "treemapify", "svglite"),
  repos = "https://mirrors.tuna.tsinghua.edu.cn/CRAN/",
  dependencies = NA
)
Other commonly used domestic CRAN mirrors include:
- TUNA (Tsinghua):
https://mirrors.tuna.tsinghua.edu.cn/CRAN/ - USTC:
https://mirrors.ustc.edu.cn/CRAN/ - Aliyun:
https://mirrors.aliyun.com/CRAN/
The visualization fonts are bundled in the assets/ directory, so no extra font installation is required.
| Environment Variable | Description | Default |
|---|---|---|
GITHUB_USERNAME |
Target username | mingcheng(Yes, it's me!) |
GITHUB_PER_PAGE(Optional) |
Repos per API call | 100 |
You can also manually start the GitHub Actions process from the "Actions" tab in your repository, and then execute the analysis by clicking the "Run workflow" button.
The bundled visualization font is Dank Mono.
This project is licensed under the MIT License, see LICENSE.md for details.