-
Notifications
You must be signed in to change notification settings - Fork 2.6k
docs: Query Profiler addition to User Guide #26623
New issue
Have a question about this project? Sign up for a free GitHub account to open an issue and contact its maintainers and the community.
By clicking “Sign up for GitHub”, you agree to our terms of service and privacy statement. We’ll occasionally send you account related emails.
Already on GitHub? Sign in to your account
base: main
Are you sure you want to change the base?
Changes from 2 commits
File filter
Filter by extension
Conversations
Jump to
Diff view
Diff view
There are no files selected for viewing
| Original file line number | Diff line number | Diff line change |
|---|---|---|
|
|
@@ -56,9 +56,98 @@ orders = pl.scan_parquet( | |
| ) | ||
| ``` | ||
|
|
||
| {{code_block('polars-cloud/query-profile','execute',[])}} | ||
|
|
||
| </details> | ||
|
|
||
| {{code_block('polars-cloud/query-profile','execute',[])}} | ||
| <!-- Execute query --> | ||
|
|
||
| ## Polars Cloud Query Profiler | ||
|
|
||
| Polars Cloud has a built-in query profiler. It shows realtime status of the query during and after | ||
| execution, and gives you detailed metrics to the node level. This can help you find and analyze | ||
| bottlenecks, helping you to run your queries optimally. | ||
|
|
||
| It can be accessed from the Cluster Dashboard. | ||
|
|
||
| ### Cluster Dashboard | ||
|
|
||
| The cluster dashboard gives you insights into: | ||
|
|
||
| - system metrics (CPU, memory, and network) of all nodes on your cluster. | ||
| - an overview of the queries that are related to this cluster, scheduled, running, and finished. | ||
|
|
||
| 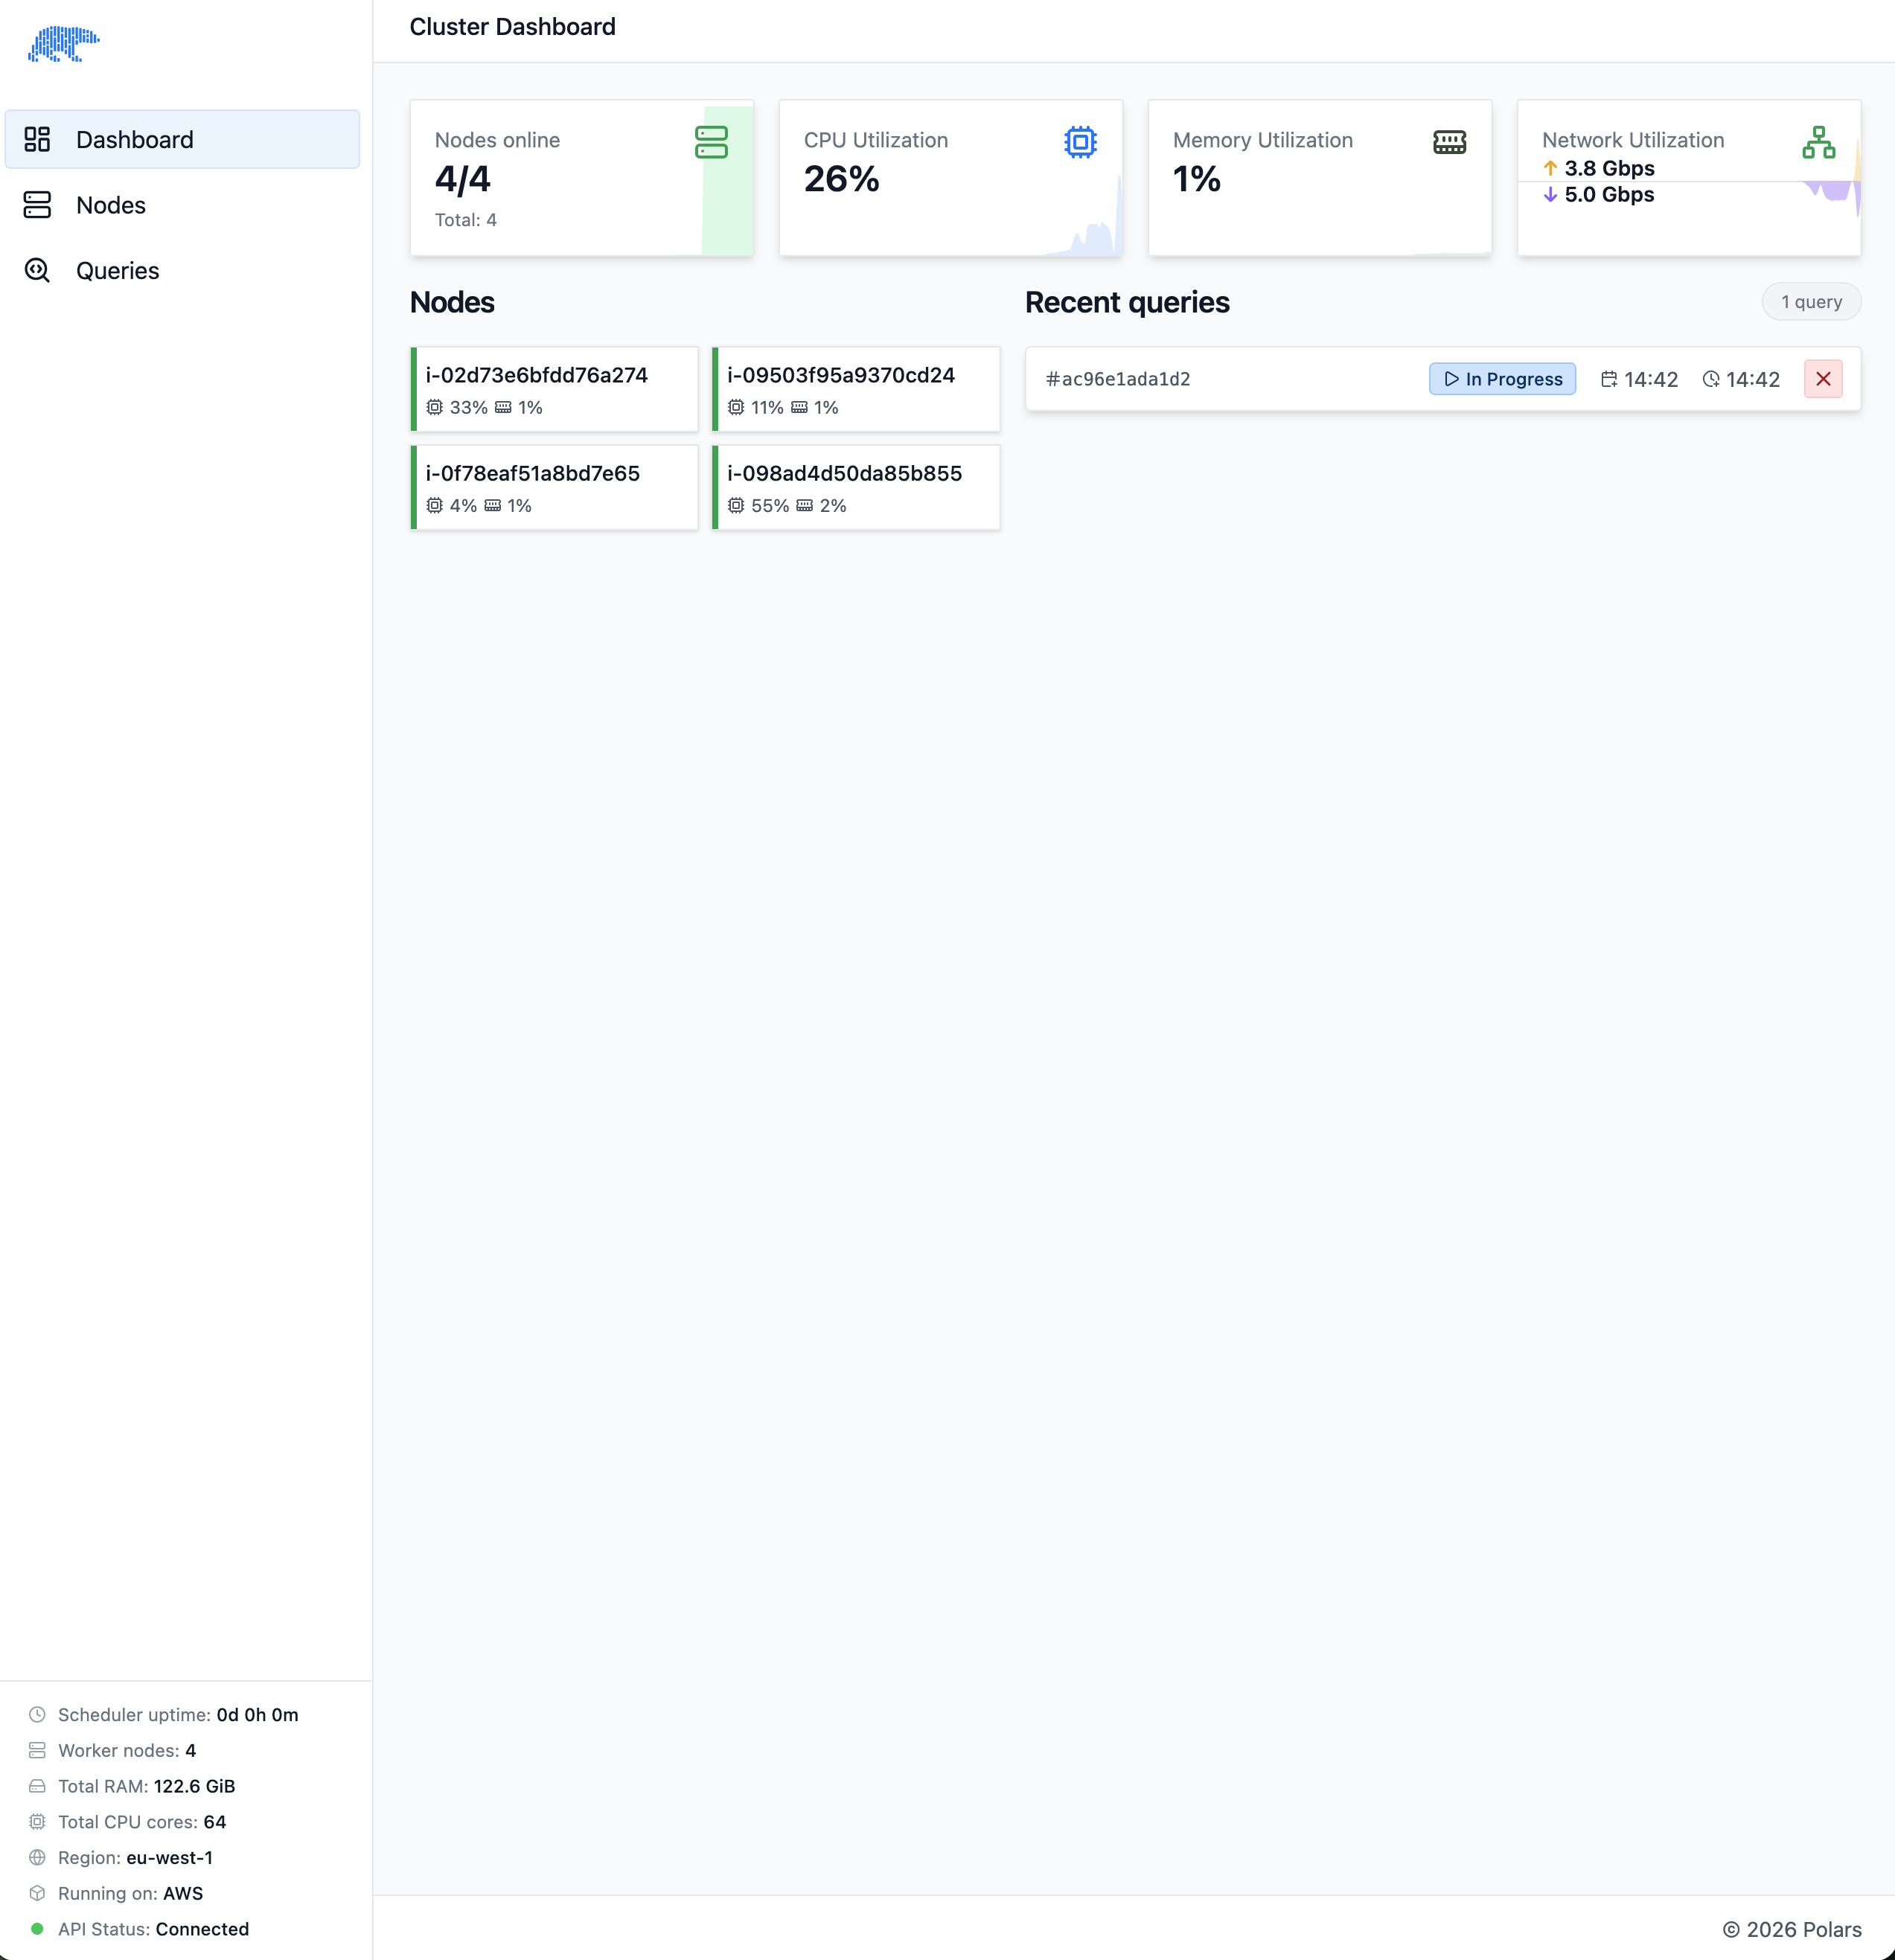 | ||
|
|
||
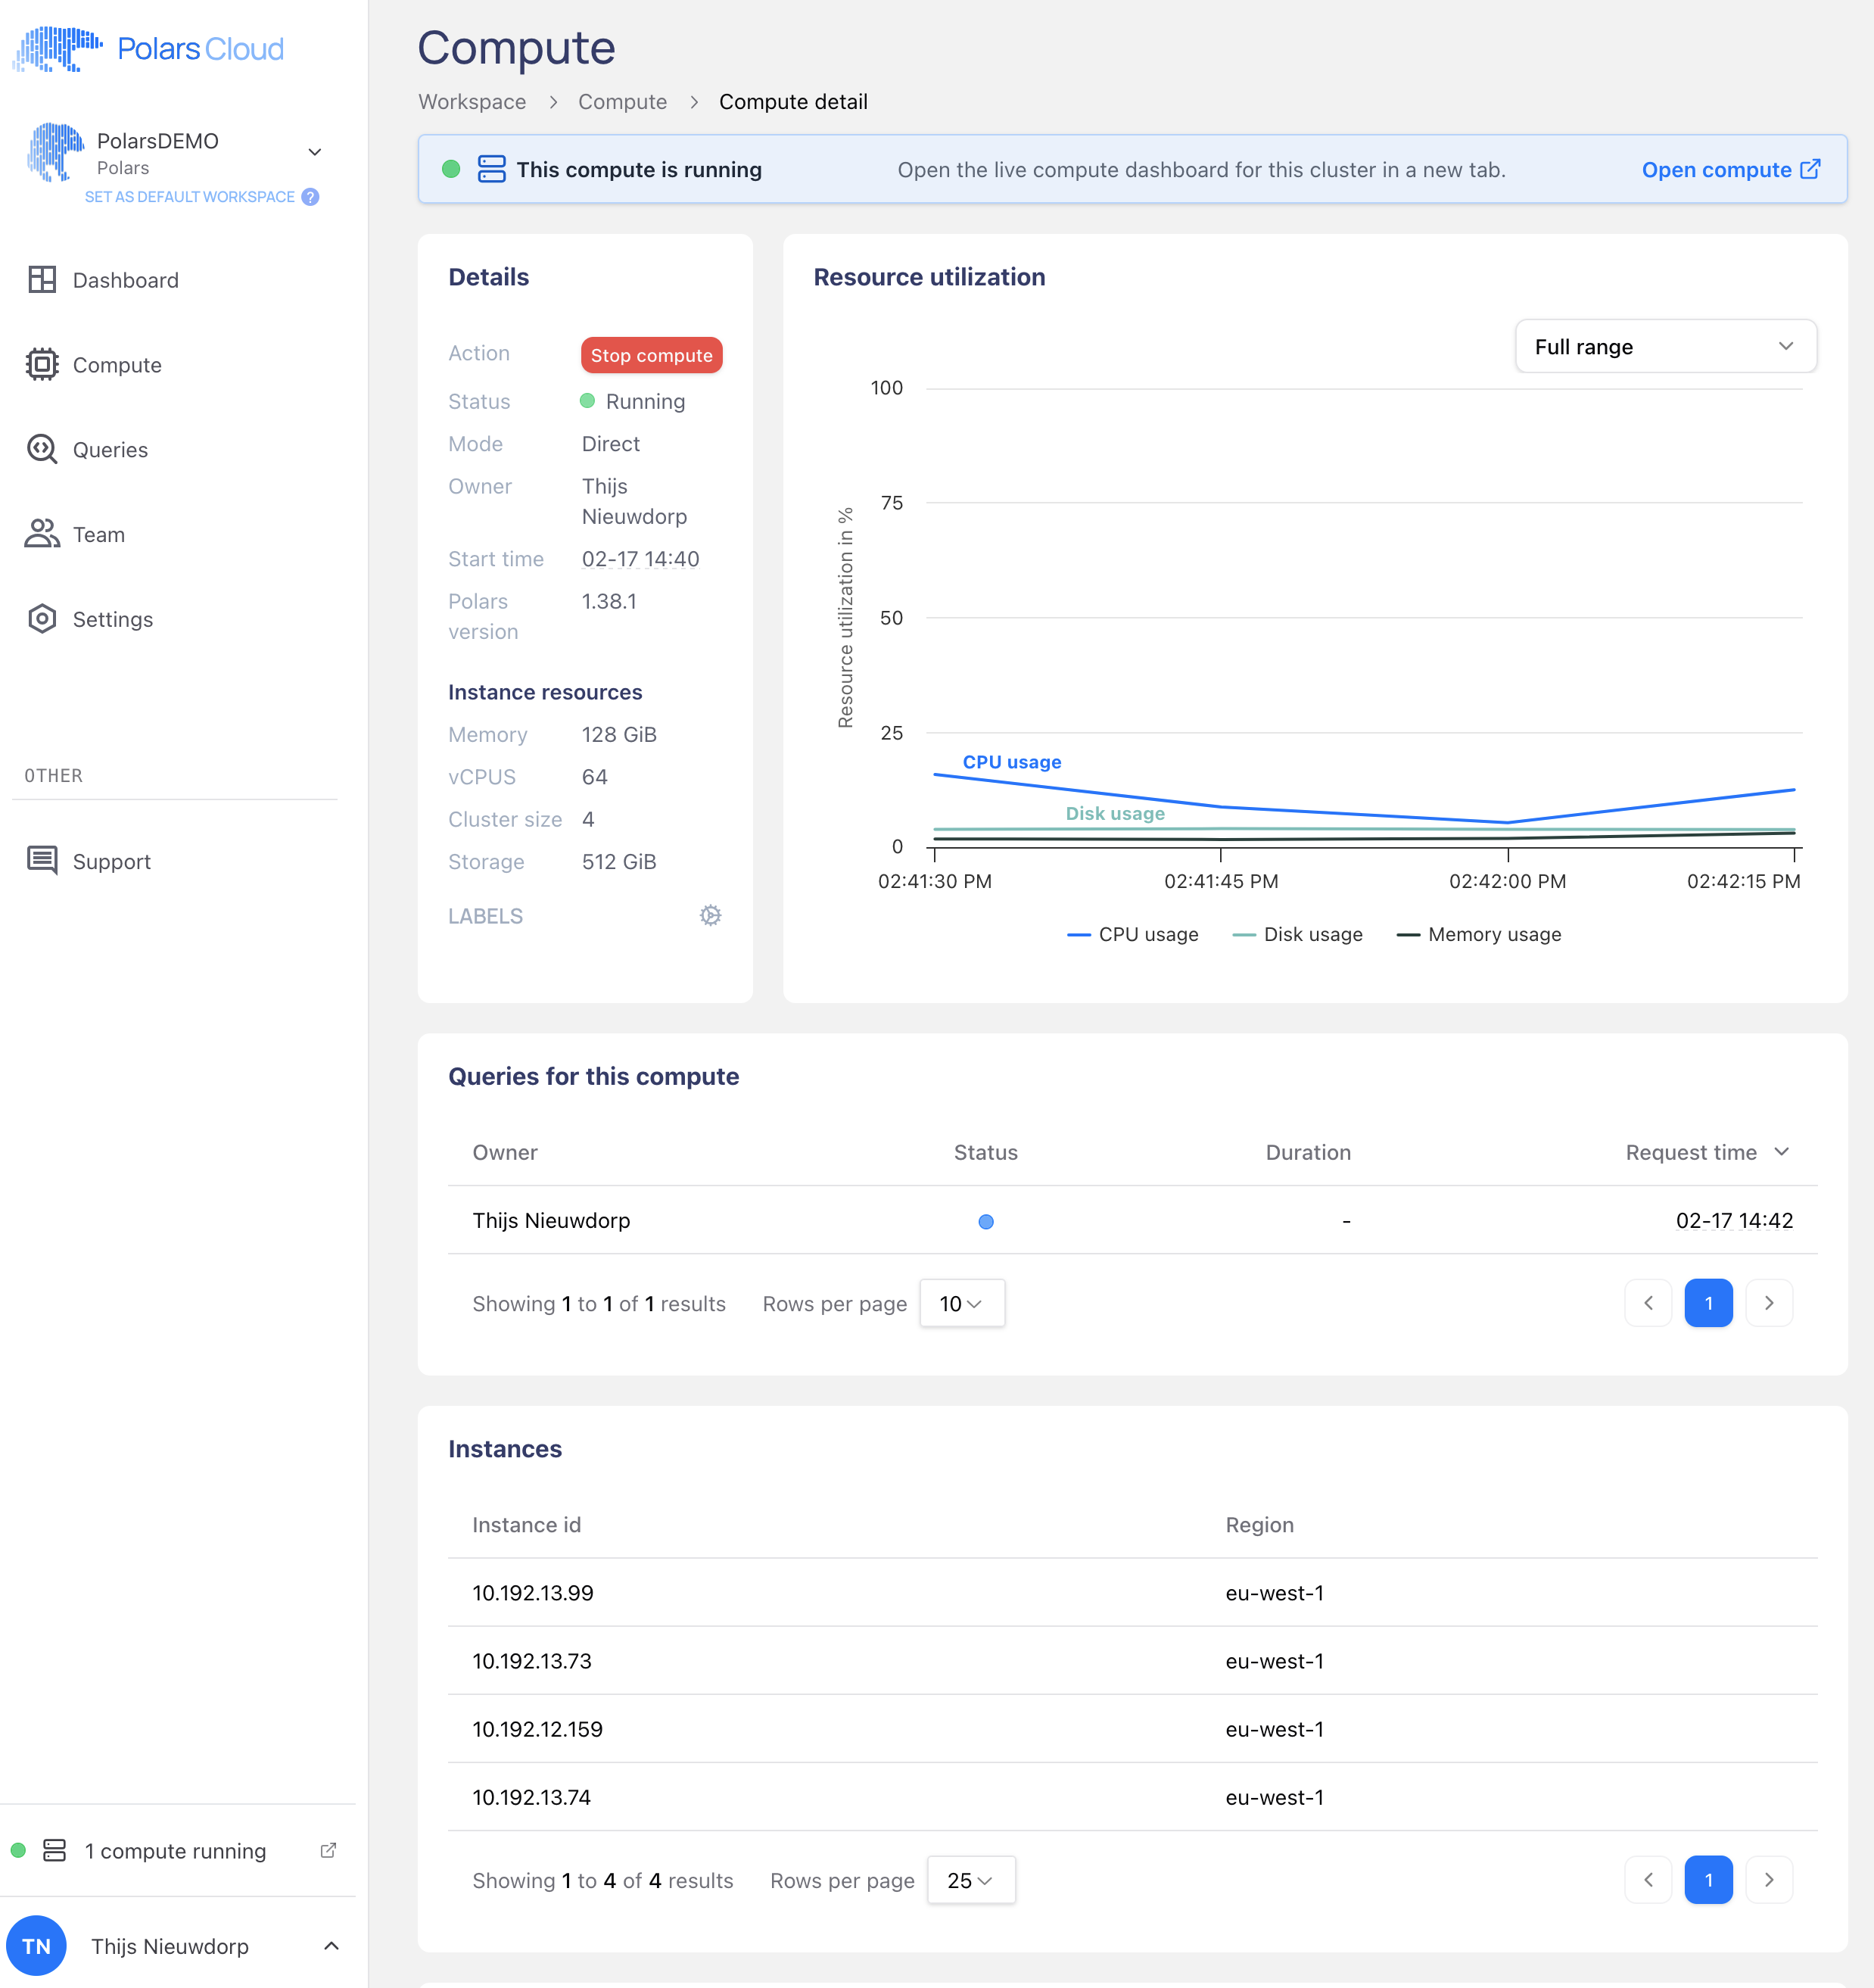
| You can get into the cluster dashboard through the pop-ups on the Polars Cloud dashboard after | ||
| starting a compute cluster, or by going to the details page of your compute. | ||
|
|
||
|  | ||
|
|
||
| This dashboard runs from the compute that you're running your queries on. It becomes available the | ||
| moment your compute has started and is no longer available after your cluster shuts down. | ||
|
|
||
| The system resources allow you to find bottlenecks and tweak your cluster configuration accordingly. | ||
|
|
||
| - In case the CPU resources max out, you can add CPUs. | ||
| - In case your memory maxes out, you can add memory. | ||
| - In case your network bandwidth maxes out, you can add more nodes. | ||
|
|
||
| ### Query Details | ||
|
|
||
| When you select a query from the cluster dashboard you open the details. An overview opens that | ||
| displays the general metrics of that query. | ||
|
|
||
| 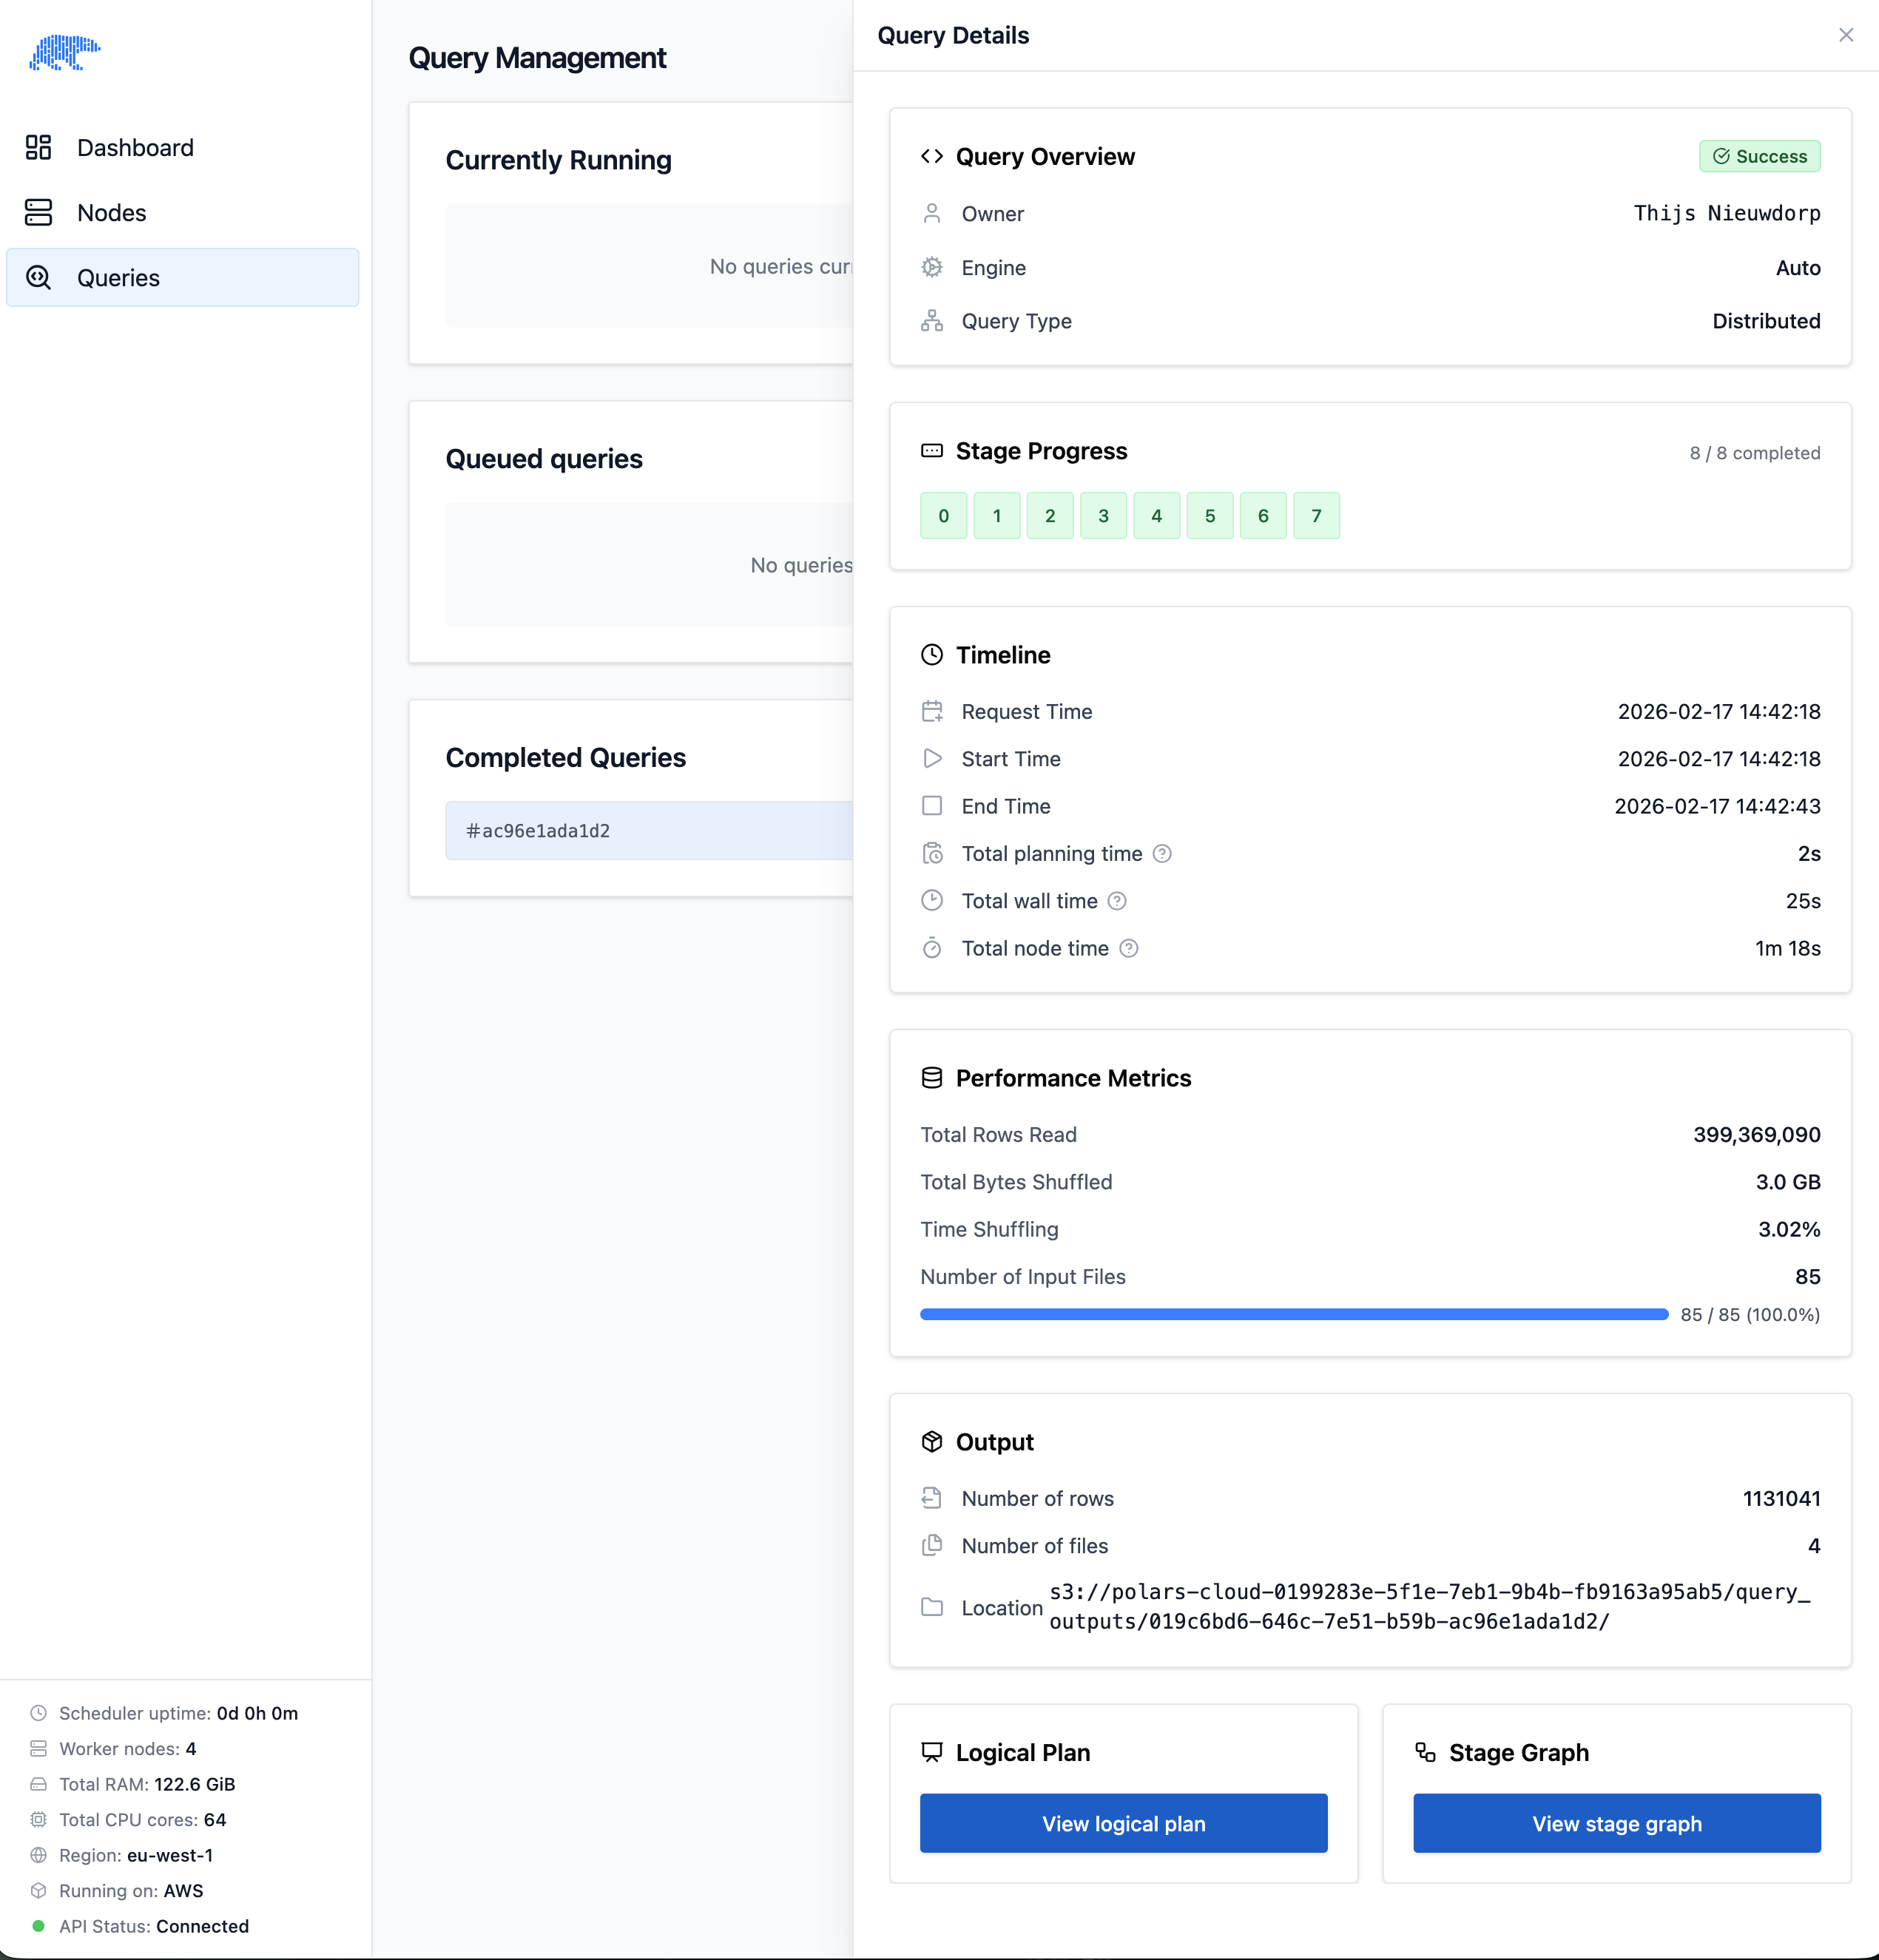 | ||
|
|
||
| From here you can dive deeper into different aspects of the query. The first one we'll explore is | ||
| the logical plan. | ||
|
|
||
| ### Logical Plan | ||
|
|
||
| In Polars, a logical plan is the intermediate representation (IR) of a query that describes what | ||
| operations to perform, before physical execution details are decided. This shows the graph that is a | ||
| representation of the query you sent to Polars Cloud. | ||
|
|
||
| 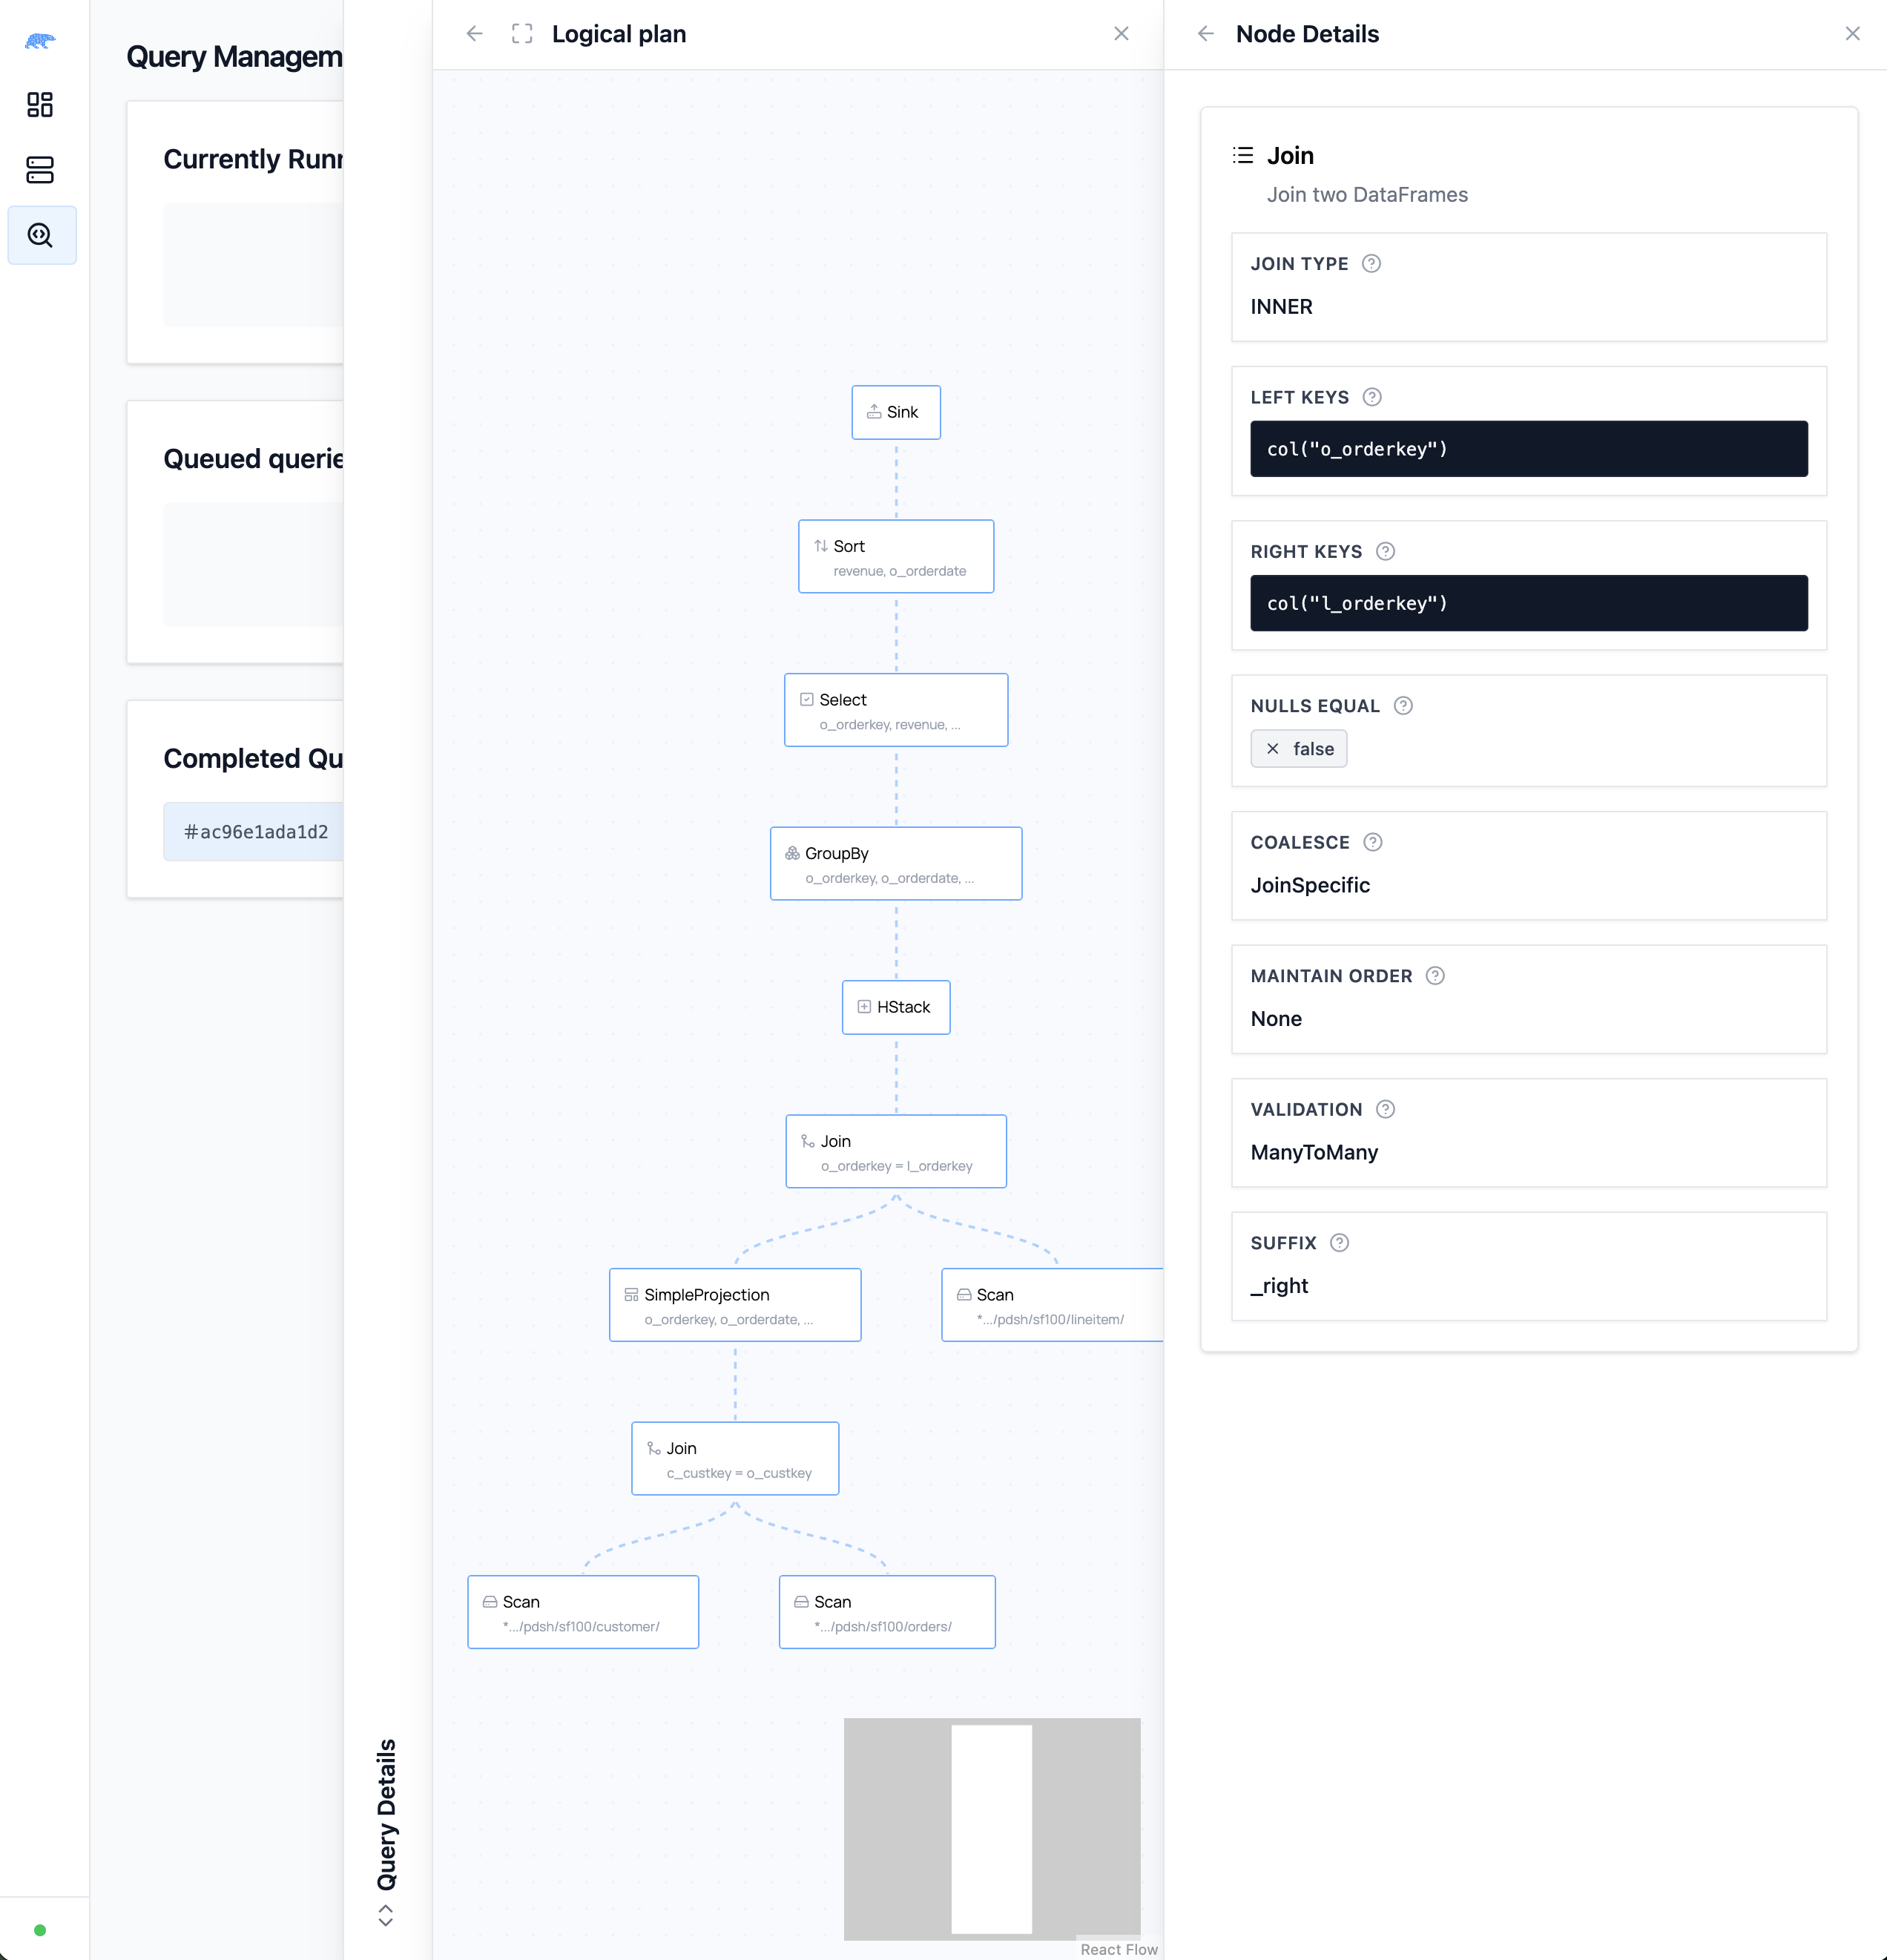 | ||
|
|
||
| <!--What can you do with this?--> | ||
|
||
|
|
||
| ### Stage Graph | ||
|
|
||
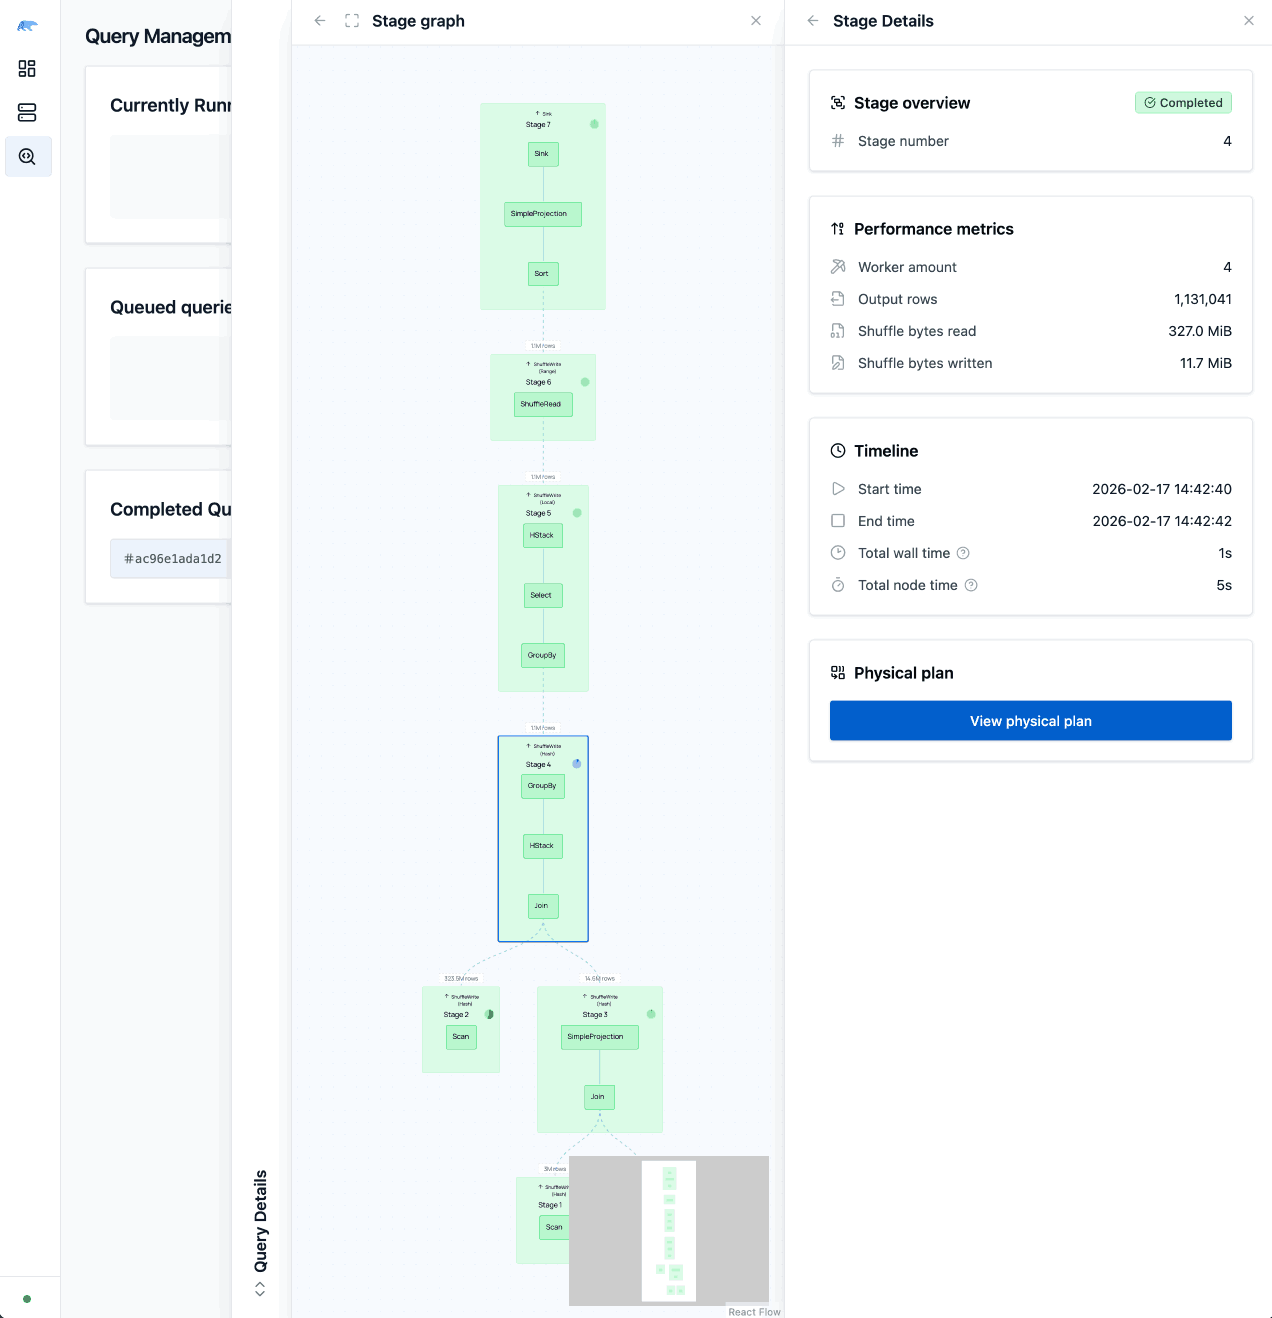
| The stage graph represents the different phases in which the plan is executed on the distributed | ||
TNieuwdorp marked this conversation as resolved.
Outdated
Show resolved
Hide resolved
|
||
| cluster. | ||
|
|
||
| From the overview with the stage graph you can click the stage itself, opening the stage graph | ||
| details. | ||
|
|
||
|  | ||
|
|
||
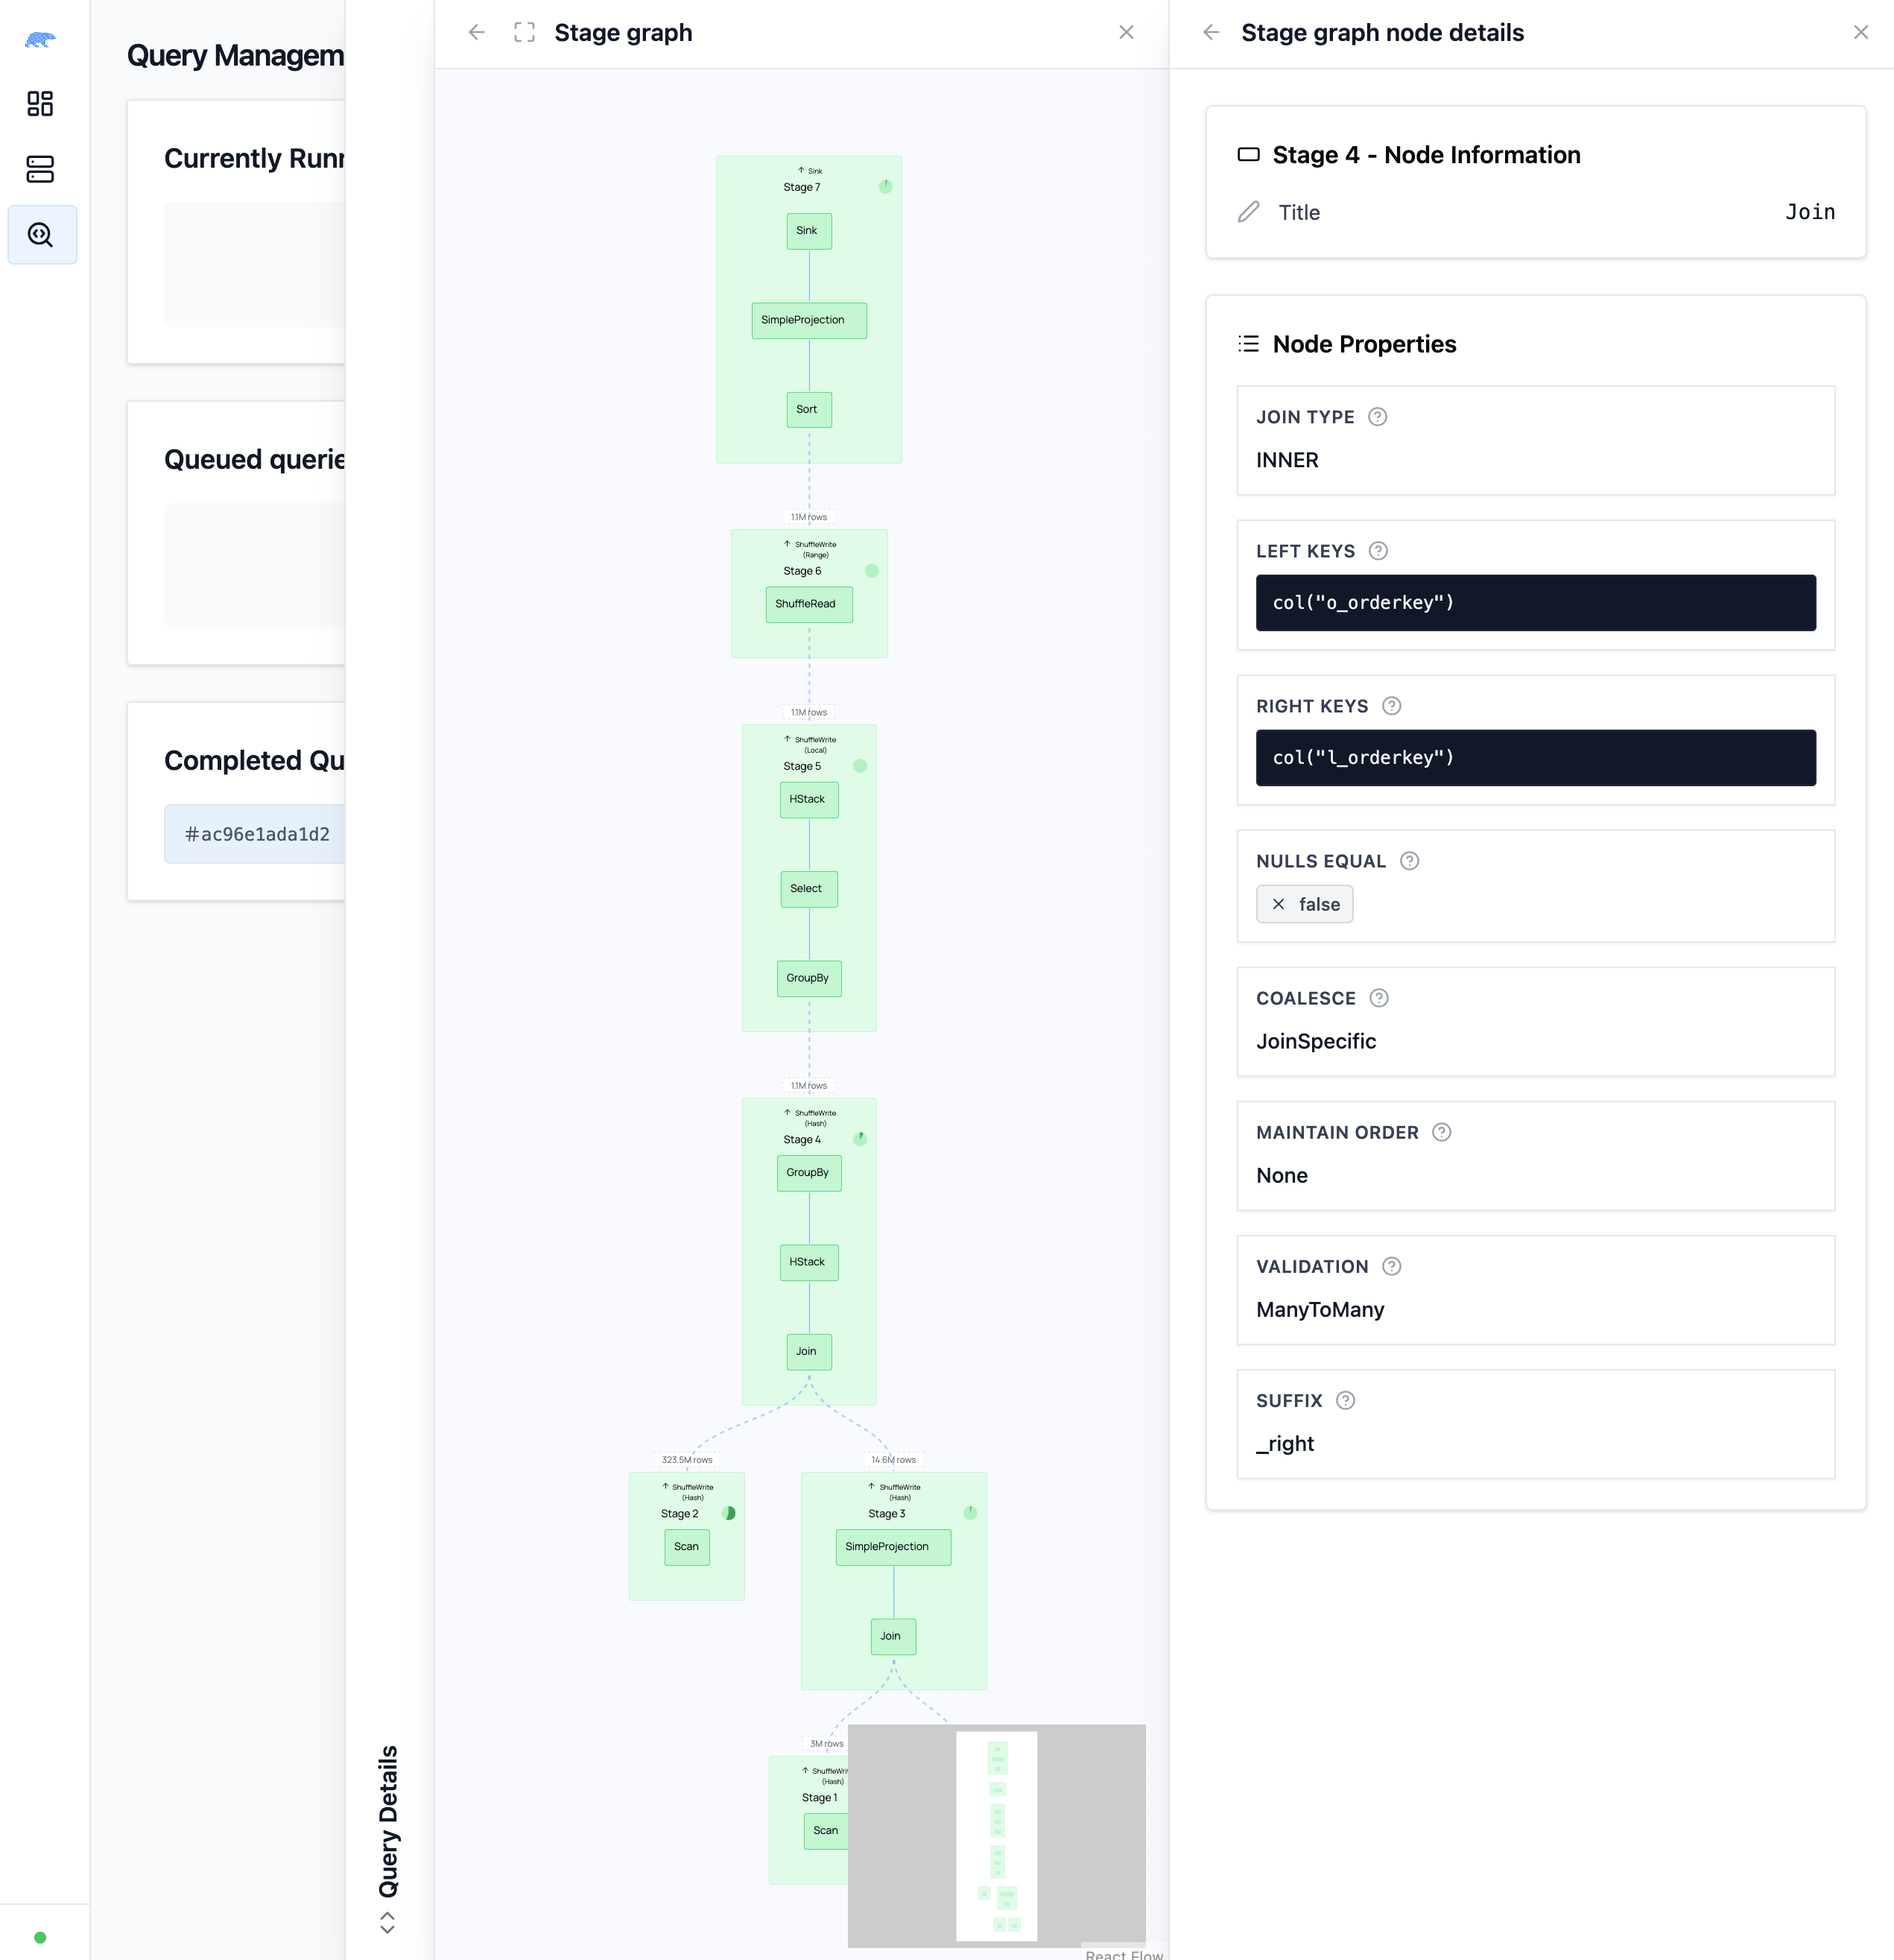
| Alternatively, you can click one of the nodes in any stage to open up its details. | ||
TNieuwdorp marked this conversation as resolved.
Outdated
Show resolved
Hide resolved
|
||
|
|
||
|  | ||
|
|
||
| <!-- what is the exact definition of a stage?--> | ||
TNieuwdorp marked this conversation as resolved.
Outdated
Show resolved
Hide resolved
|
||
|
|
||
| When executing a query single node, this is not available. | ||
TNieuwdorp marked this conversation as resolved.
Outdated
Show resolved
Hide resolved
|
||
|
|
||
| ### Physical Plan | ||
TNieuwdorp marked this conversation as resolved.
Show resolved
Hide resolved
|
||
|
|
||
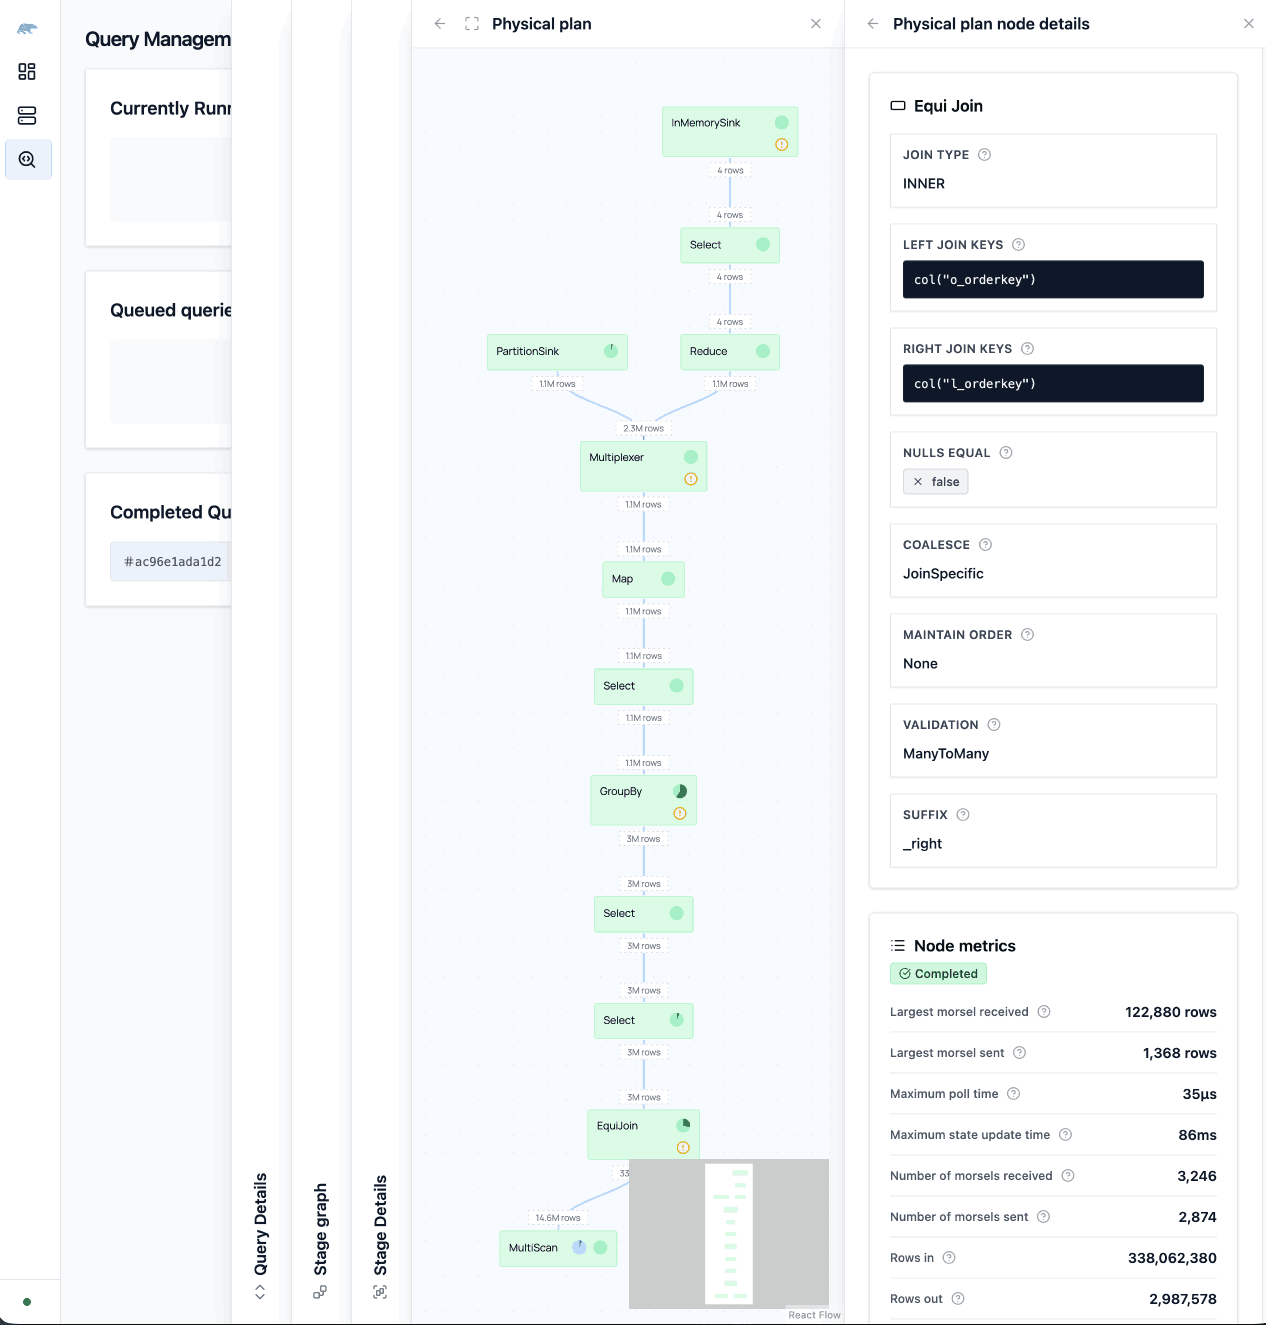
| The physical plan shows the strategy that was used to execute the query. | ||
TNieuwdorp marked this conversation as resolved.
Outdated
Show resolved
Hide resolved
|
||
|
|
||
|  | ||
|
|
||
| In it you can find the time spent per node, identifying choke points. Additionally some nodes are | ||
| marked with warnings that they're memory intensive. In the details pane you can find specific | ||
TNieuwdorp marked this conversation as resolved.
Outdated
Show resolved
Hide resolved
|
||
| metrics on how many rows went in and out, what the morsel sizes were and how many went through, and | ||
| more. | ||
|
|
||
| ## Profile with the Polars Cloud SDK | ||
|
|
||
| Besides the query profiler in the cluster dashboard, you can also get diagnostic information through | ||
| the Polars Cloud SDK. | ||
|
|
||
| ### `QueryProfile` and `QueryResult` | ||
|
|
||
| The `await_profile` method can be used to monitor an in-progress query. It returns a QueryProfile | ||
| object containing a DataFrame with information about which stages are being processed across | ||
|
|
@@ -105,7 +194,7 @@ As each worker starts and completes each stage of the query, it notifies the lea | |
| `await_profile` method will poll the lead worker until there is an update from any worker, and then | ||
| return the full profile data of the query. | ||
|
|
||
| The QueryProfile object also has a summary property to return an aggregated view of each stage. | ||
| The `QueryProfile` object also has a `summary` property to return an aggregated view of each stage. | ||
|
|
||
| {{code_block('polars-cloud/query-profile','await_summary',[])}} | ||
|
|
||
|
|
@@ -129,3 +218,38 @@ shape: (13, 6) | |
| │ 7 ┆ Execute IR ┆ true ┆ i-xxx ┆ 356662µs ┆ 1131041 ┆ 289546496 ┆ 0 │ | ||
| └──────────────┴──────────────┴───────────┴────────────┴──────────────┴─────────────┴───────────────────────┴────────────────────┘ | ||
| ``` | ||
|
|
||
| ### Plan | ||
|
Member
There was a problem hiding this comment. Choose a reason for hiding this commentThe reason will be displayed to describe this comment to others. Learn more. This is really subpar from the dashboard. If we add this to the user-guide, I think it should be somewhere else.
Collaborator
Author
There was a problem hiding this comment. Choose a reason for hiding this commentThe reason will be displayed to describe this comment to others. Learn more. Yeah, I agree. The interface is way more detailed and practical to explore. I already put this in its own section to separate it. But since it is Polars Cloud SDK functionality for query profiling, I wouldn't know where else to put it? |
||
|
|
||
| `QueryProfile` also exposes `.plan()` to retrieve the physical plan as a string, and `.graph()` to | ||
| render it as a visual diagram. See [Explain](#explain) below for details. | ||
|
|
||
| Use `.plan()` to retrieve the executed query plan as a string. This is useful for understanding | ||
| exactly how Polars executed your query, including the physical stages and operations performed | ||
| across the cluster. | ||
|
|
||
| {{code_block('polars-cloud/query-profile','explain',['QueryResult'])}} | ||
|
|
||
| ```text | ||
| # TODO: add example output | ||
| ``` | ||
|
|
||
| You can also retrieve the optimized intermediate representation (IR) of the query before execution | ||
| by passing `"ir"` as the plan type. | ||
|
|
||
| {{code_block('polars-cloud/query-profile','explain_ir',['QueryResult'])}} | ||
|
|
||
| ```text | ||
| # TODO: add example output | ||
| ``` | ||
|
|
||
| ```Graph | ||
| Both `plan()` and `graph()` are available on `QueryResult` (with `plan_type` set to `"physical"` or | ||
| `"ir"`) and on `QueryProfile` (physical plan only). These methods are only available in direct mode. | ||
|
|
||
| Use `.graph()` to render the plan as a visual dot diagram using matplotlib. | ||
|
|
||
| {{code_block('polars-cloud/query-profile','graph',['QueryResult'])}} | ||
|
|
||
| <!-- TODO: Image of graph output --> | ||
| ``` | ||
Uh oh!
There was an error while loading. Please reload this page.