Prometheus exporter for collecting metrics from a Proxmox:
- Proxmox Virtual Environment (PVE) cluster
- Proxmox Virtual Environment (PVE) node
- Proxmox Backup Server
- Proxmox Mail Gateway
- Collects resource usage metrics from Proxmox nodes, VMs, and containers
- Compatible with Prometheus and Grafana for monitoring and visualization
- Proxmox VE 8.0 or later
To build from source, you need Golang 1.22.0 or later.
-
Clone the repository:
git clone https://github.com/railadeividas/prometheus-proxmox-exporter.git cd prometheus-proxmox-exporter -
Build the exporter:
go build -ldflags "-X main.buildTime=$(date -u +%Y-%m-%dT%H:%M:%SZ)" -o prometheus-proxmox-exporter main.go -
Run the exporter:
chmod +x prometheus-proxmox-exporter
./prometheus-proxmox-exporter
-
Download the latest release from GitHub:
wget https://github.com/railadeividas/prometheus-proxmox-exporter/releases/latest/download/prometheus-proxmox-exporter
-
Make it executable:
chmod +x prometheus-proxmox-exporter
-
Run the exporter:
./prometheus-proxmox-exporter --web.listen-address="[::]:9221" --runtime.scrape_interval=10
To run the exporter as a systemd service, follow these steps:
-
Create a systemd service file:
sudo nano /etc/systemd/system/prometheus-proxmox-exporter.service
-
Add the following content:
[Unit]
Description=Prometheus Proxmox Exporter
After=network.target

[Service]
User=root
Group=root
ExecStart=/usr/local/bin/prometheus-proxmox-exporter --web.listen-address="[::]:9221" --runtime.scrape_interval=10
Restart=always
RestartSec=10s

[Install]
WantedBy=multi-user.target
-
Move the binary to
/usr/local/bin/:sudo mv prometheus-proxmox-exporter /usr/local/bin/
-
Reload systemd and enable the service:
sudo systemctl daemon-reload sudo systemctl enable prometheus-proxmox-exporter sudo systemctl start prometheus-proxmox-exporter -
Check the service status:
sudo systemctl status prometheus-proxmox-exporter
The exporter supports environment variables for configuration:
| Variable | Description | Default |
|---|---|---|
web.listen-address |
Address to listen on for metrics | [::]:9221 |
runtime.scrape_interval |
Interval for scraping metrics | 10 |
Example usage:
./prometheus-proxmox-exporter --web.listen-address="[::]:9221" --runtime.scrape_interval=10Add the exporter as a scrape target in your Prometheus configuration:
scrape_configs:
  - job_name: 'proxmox'
    static_configs:
- targets: ['localhost:9221']| Metric | Description |
|---|---|
pve_resource_cpu |
CPU utilization |
pve_resource_disk |
Used disk space in bytes |
pve_resource_diskread |
The amount of bytes the guest read from its block devices since the guest was started |
pve_resource_diskwrite |
The amount of bytes the guest wrote to its block devices since the guest was started |
pve_resource_maxcpu |
Number of available CPUs |
pve_resource_maxdisk |
Storage size in bytes |
pve_resource_maxmem |
Number of available memory in bytes |
pve_resource_mem |
Used memory in bytes |
pve_resource_netin |
The amount of traffic in bytes that was sent to the guest over the network since it was started |
pve_resource_netout |
The amount of traffic in bytes that was sent from the guest over the network since it was started |
pve_resource_status |
Resource type dependent status |
pve_resource_uptime |
Uptime of node or virtual guest in seconds |
pve_storage_disk |
Used disk space in bytes |
pve_storage_maxdisk |
Storage size in bytes |
pve_storage_status |
Storage size in bytes |
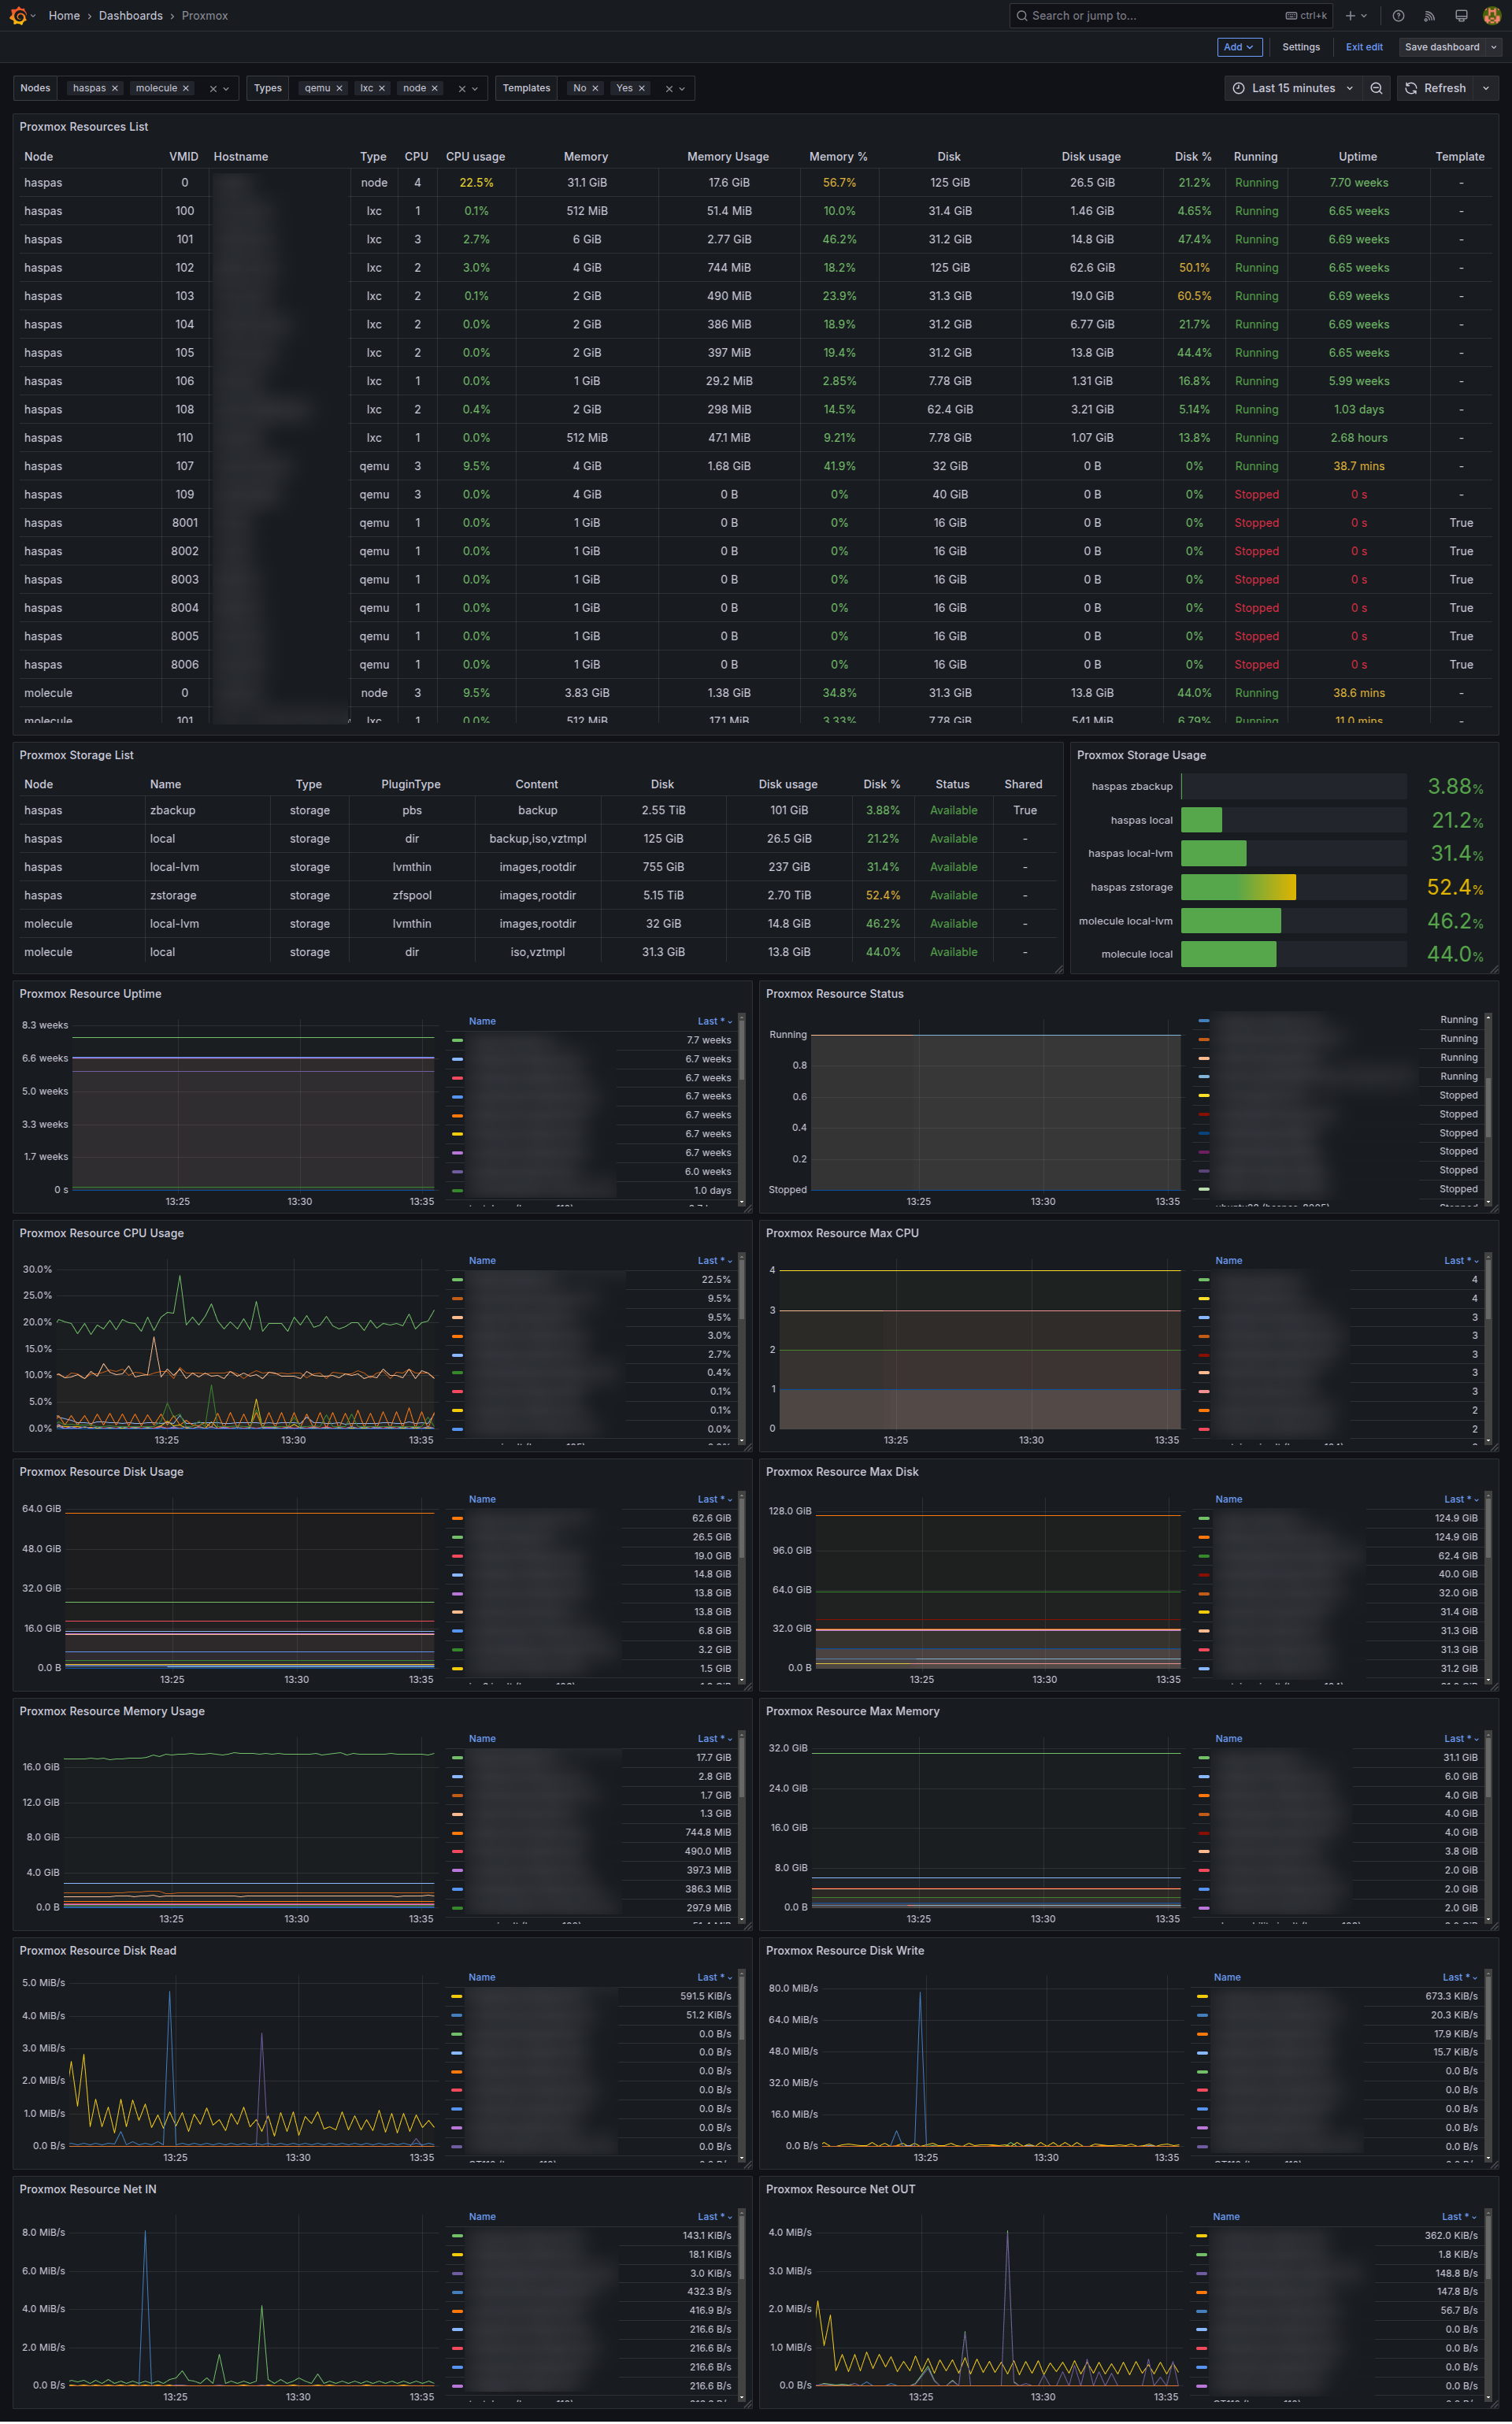
You can visualize the collected metrics in Grafana by importing a pre-built dashboard or creating your own.
This project is licensed under the MIT License.
Contributions are welcome! Feel free to open an issue or submit a pull request.
For questions or support, open an issue in this repository.