In this project we use Pandas & Seaborn to analyze and answer business questions about 12 months worth of sales data. The data contains thousands of electronics store purchases broken down by month, product type, cost, purchase address, etc.
Data : Kaggle - Monthly Sales 2019
- Data Cleaning
- Data Analysis
- Drop NaN values from DataFrame
- Removing rows based on a condition
- Change the type of columns (to_numeric, to_datetime, astype)
- Extracting additional features from existing columns :
- Month, Day of week, Hour from Order Date
- State, City, Zip Code from Purchase Address
- Creating Total sales amount column
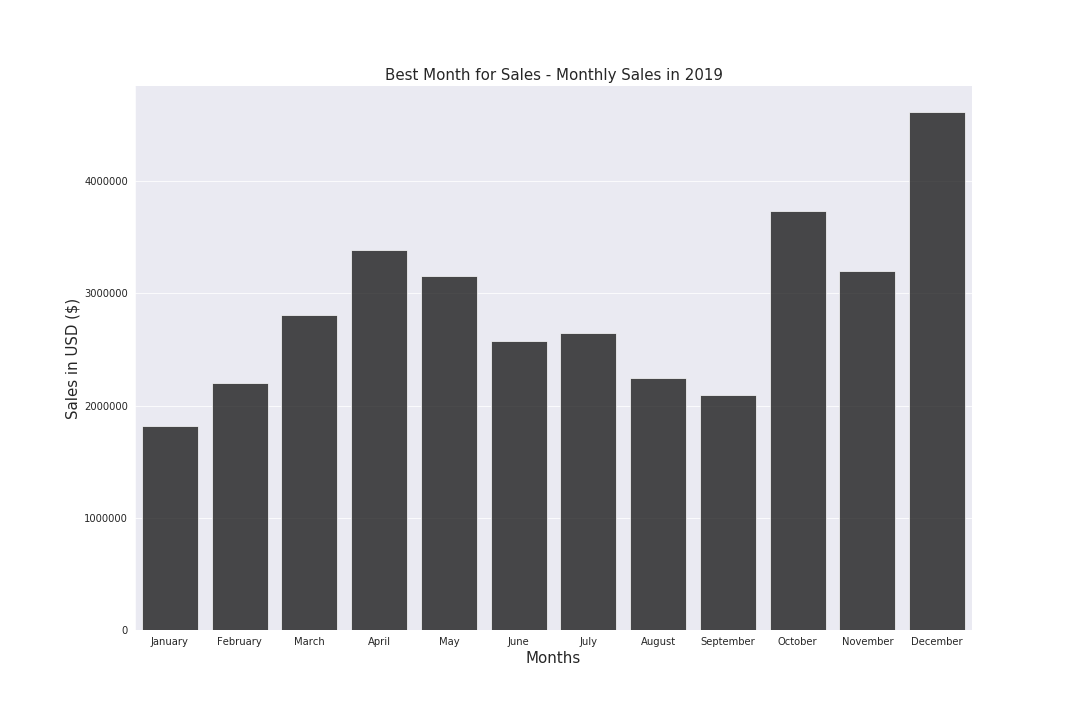
We can see that January is the worst month for Sales and December is the best month. We also see that sales keep increasing till April after which they start decreasing again; this is interesting and further analysis can be done on this, we can try to a correlation to the marketing and advertisement budget. It is seen that the months of October, November and December report good sales and it is expected as these months contain most of the major US holidays such as Halloween, Thanksgiving Day, Cyber Monday, Black Friday Sale and Christmas. People usually buy a lot of gifts during these holidays.
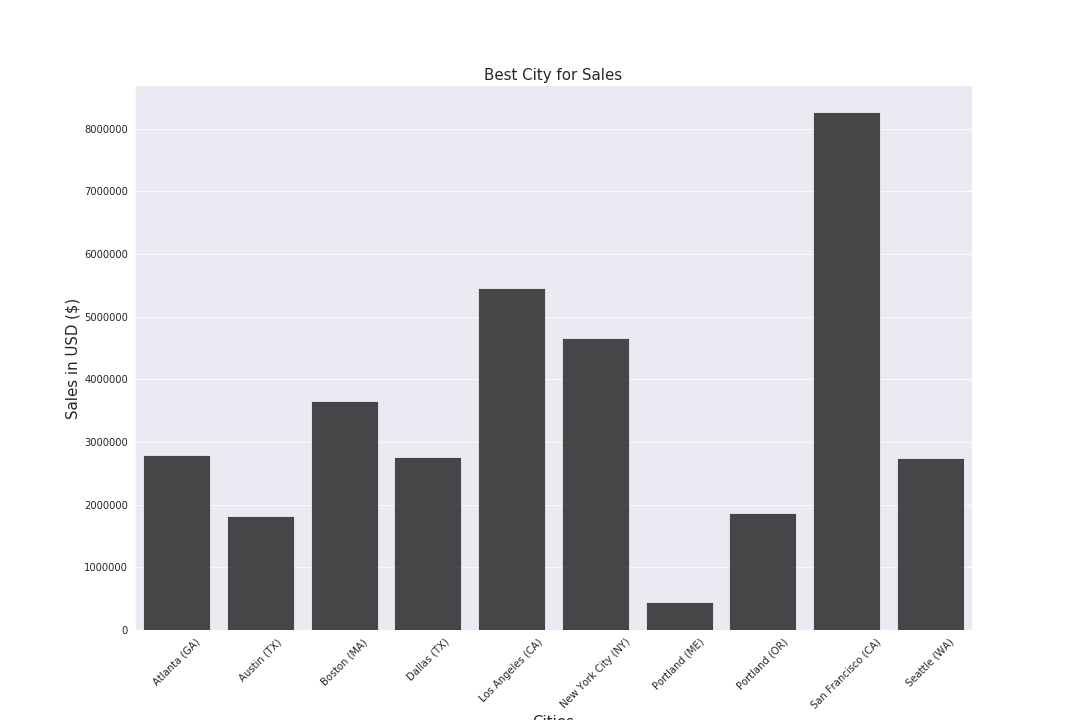
San Francisco is the best city for sales which make sense because Silicone Valley is located here which employs some of the world's best IT employees who tend to use more electronic items. We can also look at further questions such as the amount of marketing and advertisement budget to determine why cities such as Portland and Austin are performing poor as compared to other cities.
3. What time should we display advertisements to maximize the likelihood of customers buying the product? ( Best Time for Sales )
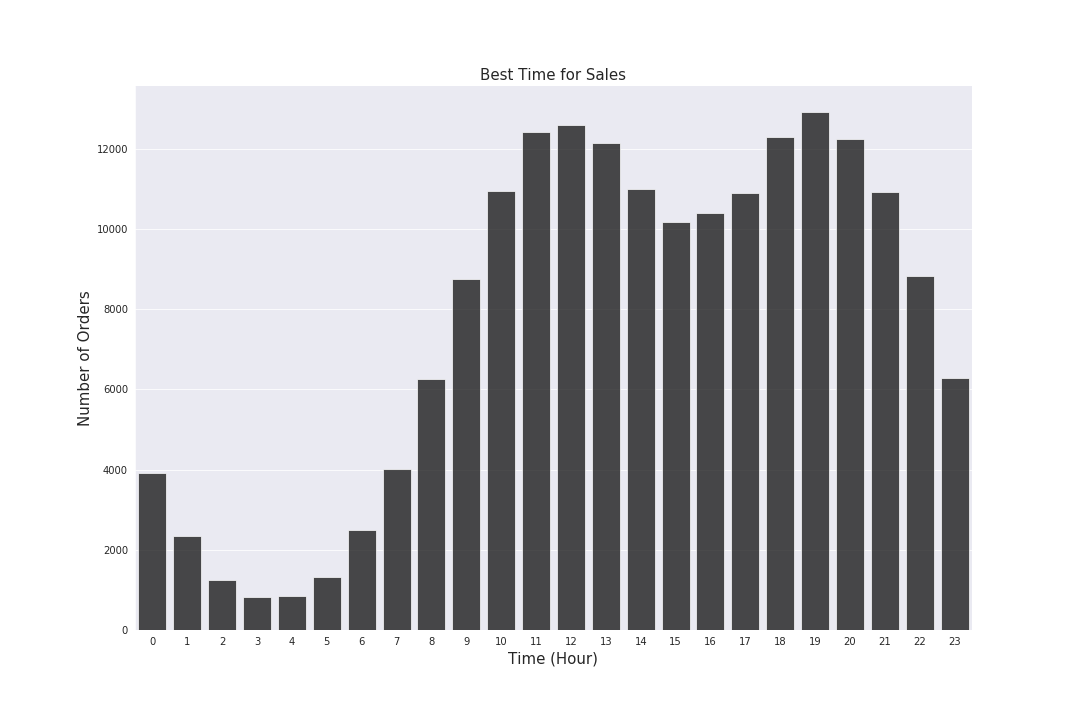
Here we can see that 12PM and 7PM are the two hours during which we have the highest sales. This makes sense because these are the hours during which people are generally going to or returning from work. Thus if we ran an advertisement during these 2 hours, it will get maximum visibility and in turn increase the chance of customers buying the product.
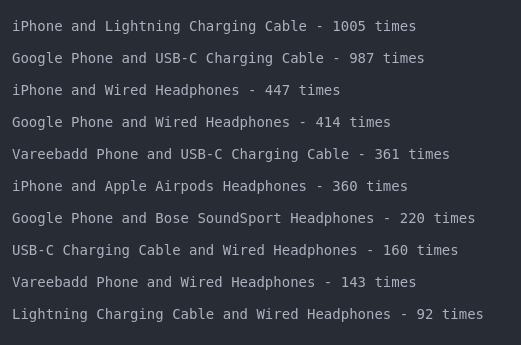
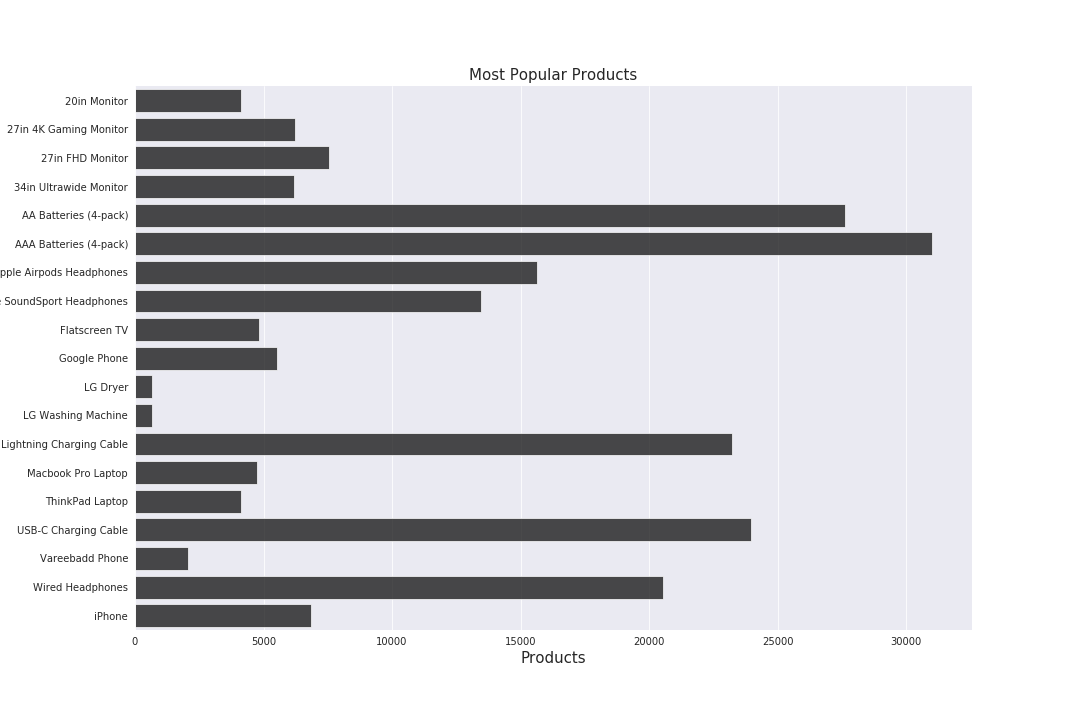
This data is very useful as using this we can create offers or promotions which can increase our sales further. When a person buys a phone we can offer a Lightning Charging Cable or a Wired Headphones at a discounted price which will push more customers to buy these products.