A Phoenix LiveView dashboard for debugging and monitoring Sagents agents in real-time. Provides visibility into agent execution, message history, tool calls, middleware actions, todos, sub-agents, and event streams.
- Real-time Agent Monitoring: View all running agents with status, uptime, and viewer counts
- Presence-Based Discovery: Agents are discovered instantly via Phoenix Presence (no polling)
- Auto-Follow First: Automatically follow the first matching agent that appears for immediate debugging
- Sub-Agent Visibility: Monitor sub-agents spawned by parent agents with full event tracking
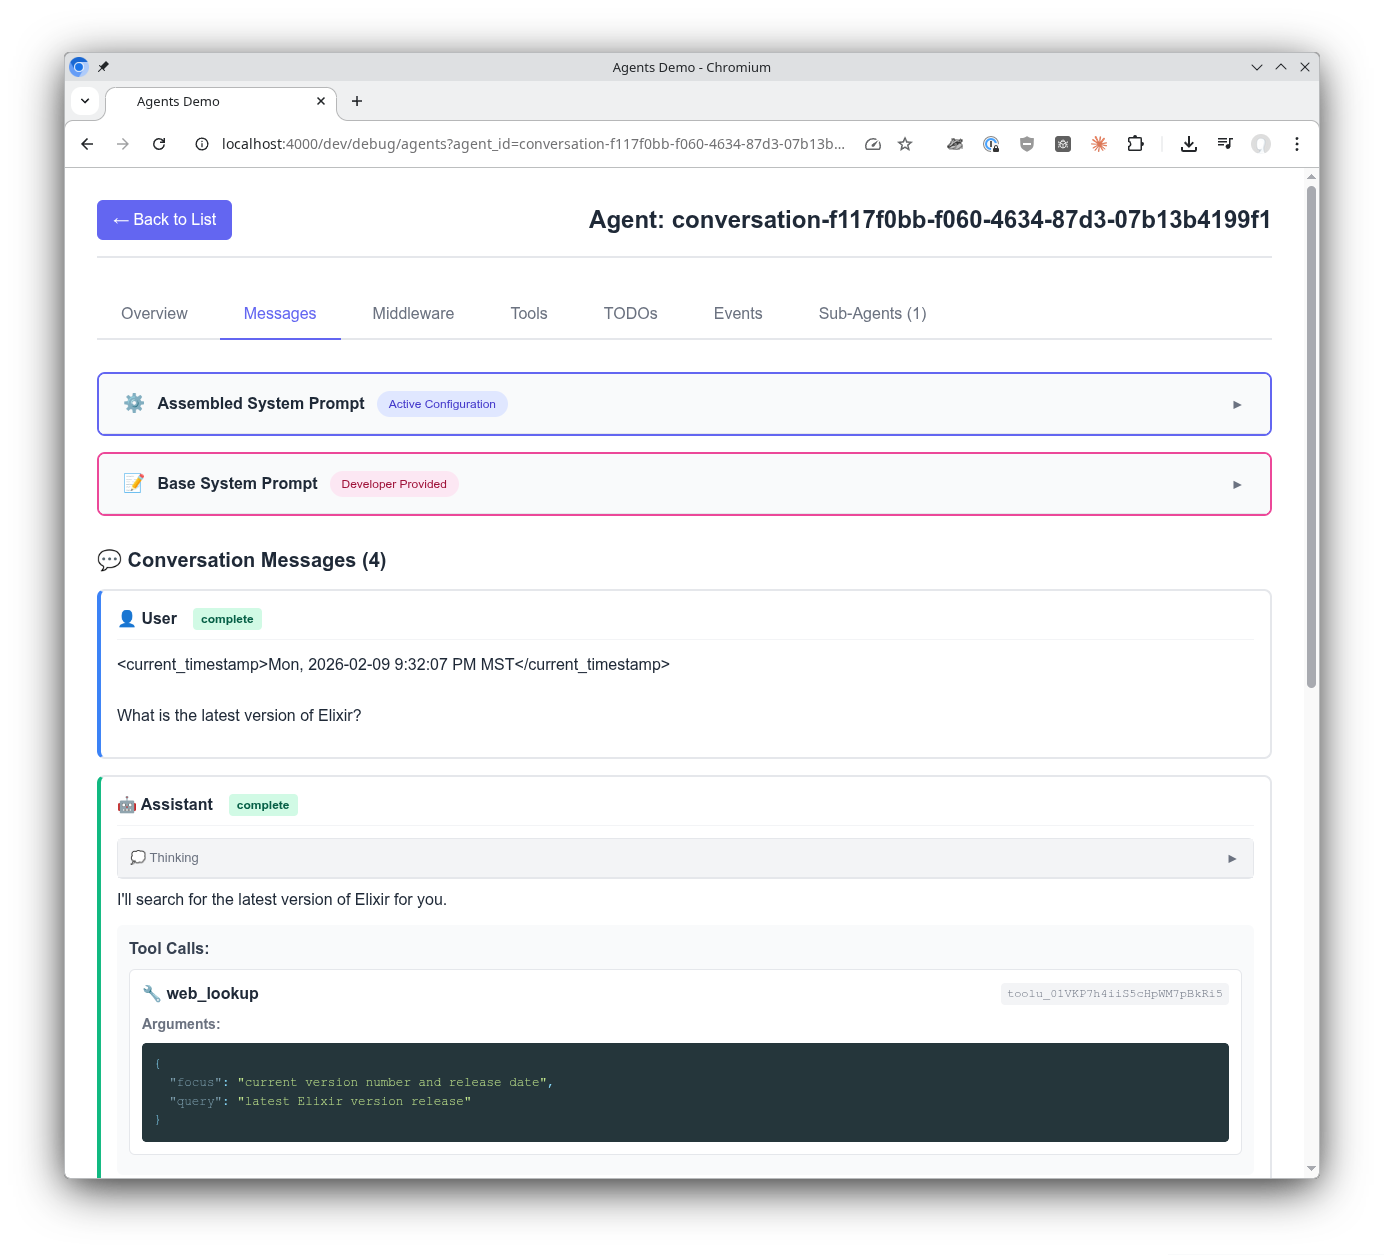
- Message Inspection: Browse complete message history with tool calls, results, and thinking blocks
- Event Stream: Live feed of agent events (LLM calls, middleware actions, tool executions)
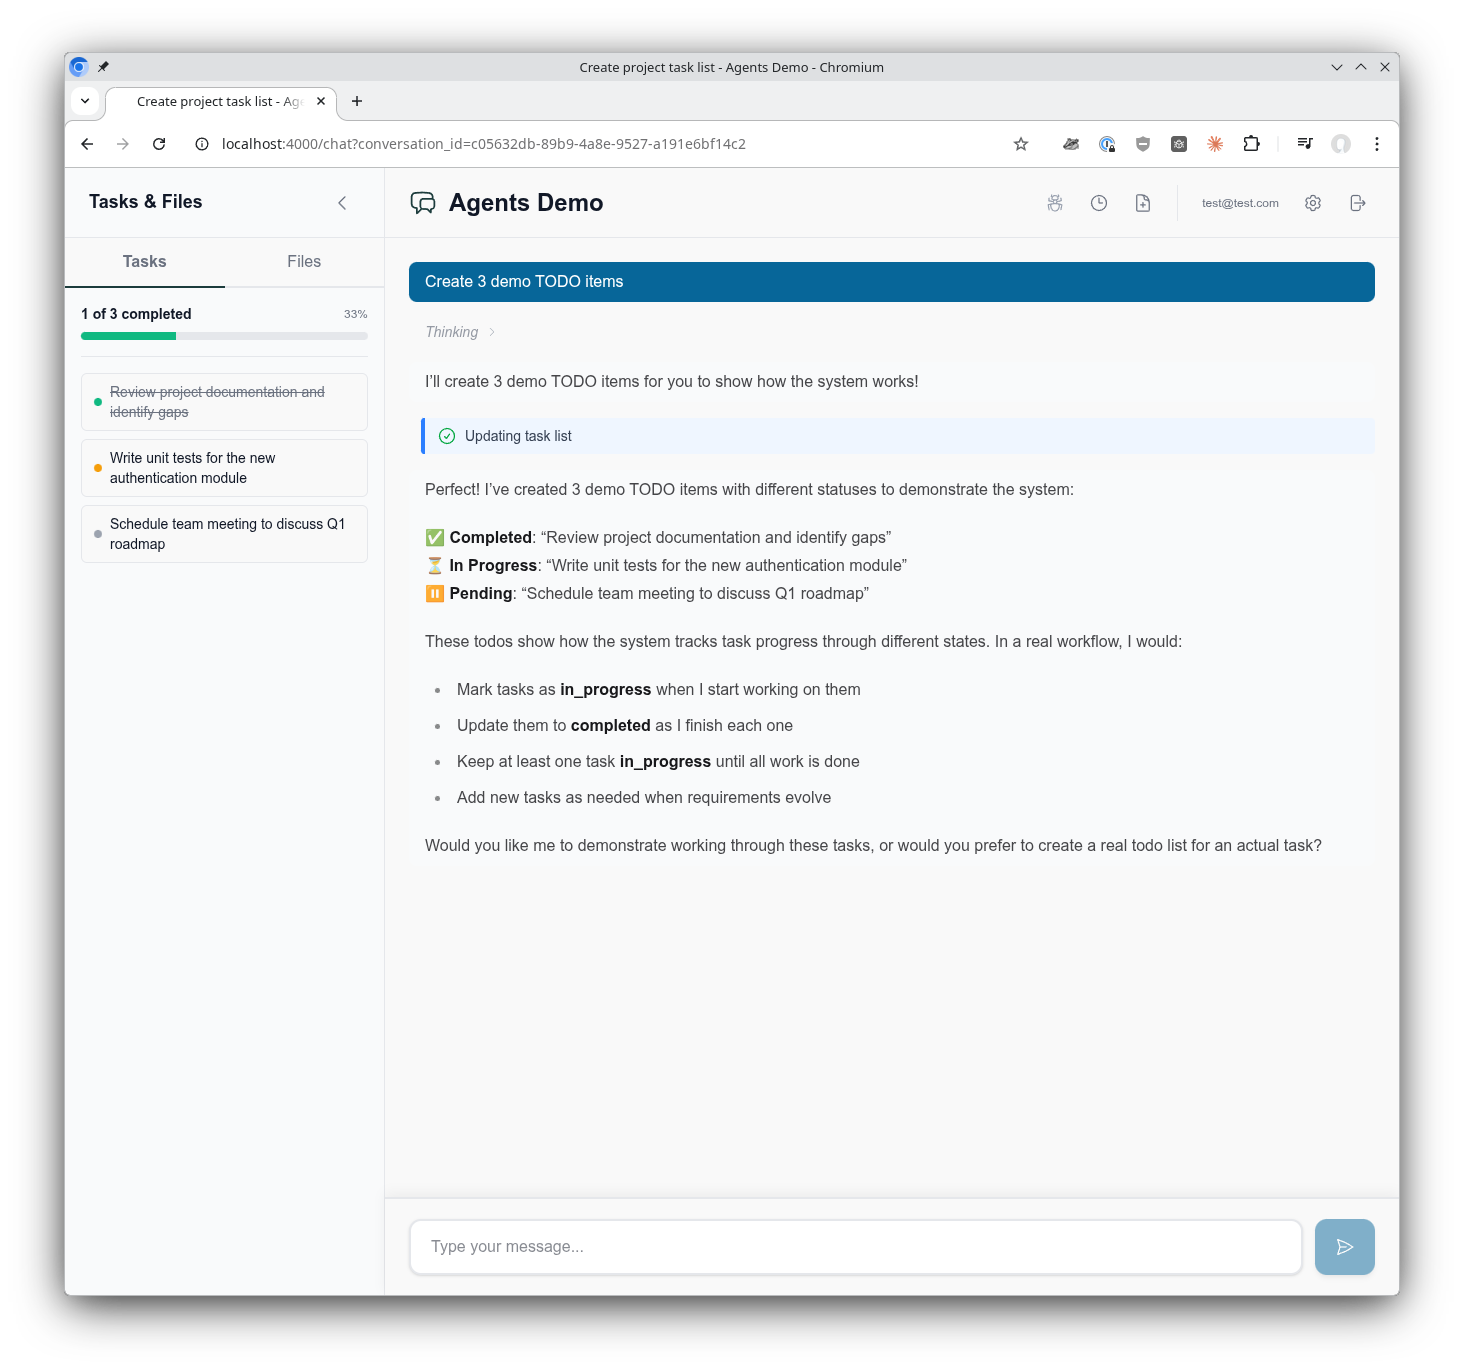
- Todo Tracking: Monitor agent task lists and progress in real-time
- Production Safe: Filter-based agent selection for production environments
Add sagents_live_debugger to your list of dependencies in mix.exs:
def deps do
  [
    {:sagents_live_debugger, "~> 0.4.0-rc"}
  ]
end
Note: the
0.4.0-rc.xline depends onsagents 0.8.0-rc.xand introduces a required:pubsubrouter option (see Setup). The0.3.xline tracks the previoussagentsdependency.
Add the debugger to your Phoenix router:
# lib/my_app_web/router.ex
import SagentsLiveDebugger.Router

scope "/dev" do
  pipe_through :browser

  sagents_live_debugger "/debug/agents",
    coordinator: MyApp.Agents.Coordinator,
    pubsub: MyApp.PubSub,
    presence_module: MyAppWeb.Presence
end
The :pubsub option is the Phoenix.PubSub instance your application uses to broadcast agent and presence events — the same name you give your Phoenix.PubSub child spec in your supervision tree (typically MyApp.PubSub). The debugger subscribes to agent presence and per-conversation viewer topics on this PubSub.
Important: Ensure your application has configured the timezone database in config/config.exs:
# config/config.exs
import Config

# Required for timezone support
config :elixir, :time_zone_database, Tzdata.TimeZoneDatabase
That's it! Visit http://localhost:4000/dev/debug/agents to access the debugger.
Try it out yourself in the AgentsDemo project. It's built-in and ready to explore!
The sagents_live_debugger macro accepts the following options:
:coordinator- Your application's agent coordinator module (created through a mix task):pubsub- ThePhoenix.PubSubinstance the host application uses to broadcast agent and presence events (e.g.MyApp.PubSub). The debugger subscribes toSagents.Subscriber.presence_topic/0and to per-conversation viewer presence topics on this PubSub
:presence_module- Phoenix Presence module for real-time agent discovery and viewer tracking:live_socket_path- Custom LiveView socket path. Defaults to"/live". Must match thesocket "/live", Phoenix.LiveView.Socketdeclaration in your endpoint:csp_nonce_assign_key- Assign key(s) for CSP nonces, used when mounting the debugger inside a host application with a strict Content Security Policy. See Content Security Policy below
sagents_live_debugger "/debug/agents",
  coordinator: MyApp.Agents.Coordinator,
  pubsub: MyApp.PubSub,
presence_module: MyApp.PresenceIf your host application enforces a strict CSP that disallows inline/unsafe sources, pass :csp_nonce_assign_key so the debugger can stamp the correct nonce onto the bundled <link rel="stylesheet"> and <script> tags it emits in the root layout.
The option accepts either a single atom (used as the nonce for both style and script tags) or a map with :script and :style keys when you want to use distinct nonces per directive:
# Single nonce for both style and script
sagents_live_debugger "/debug/agents",
  coordinator: AgentsDemo.Agents.Coordinator,
  pubsub: AgentsDemo.PubSub,
  presence_module: AgentsDemoWeb.Presence,
  csp_nonce_assign_key: :csp_nonce

# Distinct nonces per directive
sagents_live_debugger "/debug/agents",
  csp_nonce_assign_key: %{
    style: :style_src_nonce,
    script: :script_src_nonce
  },
  coordinator: AgentsDemo.Agents.Coordinator,
  pubsub: AgentsDemo.PubSub,
  presence_module: AgentsDemoWeb.Presence
Your browser pipeline (or a plug earlier in the stack) is responsible for generating the nonce values and placing them on conn.assigns under the keys you supply — the debugger only reads them:
# Example plug in your browser pipeline
defmodule MyAppWeb.CSPNonce do
  import Plug.Conn

  def init(_), do: nil

  def call(conn, _) do
    conn
    |> assign(:style_src_nonce, generate_nonce())
    |> assign(:script_src_nonce, generate_nonce())
    |> put_resp_header("content-security-policy",
      "style-src 'nonce-#{conn.assigns.style_src_nonce}'; " <>
      "script-src 'nonce-#{conn.assigns.script_src_nonce}'")
  end

  defp generate_nonce, do: 18 |> :crypto.strong_rand_bytes() |> Base.url_encode64(padding: false)
end
The debugger serves its CSS and JS from cache-busted Plug routes (/css-<md5> and /js-<md5>), so with nonces wired through there are no inline assets to whitelist separately.
The debugger discovers agents in real-time using Phoenix Presence. When an agent starts with presence_module configured, it immediately appears in the debugger's agent list - no polling required.
Configure your AgentServer with presence:
AgentServer.start_link(
  agent: agent,
  pubsub: {Phoenix.PubSub, :my_pubsub},
  presence_module: MyApp.Presence
)
Agent presence metadata includes:
status- Current agent status (:idle, :running, :interrupted, etc.)started_at- When the agent started (for uptime display)last_activity_at- Last activity timestampconversation_id- Associated conversation (if any)- Custom scope fields from
filesystem_scope(e.g.,project_id,user_id)
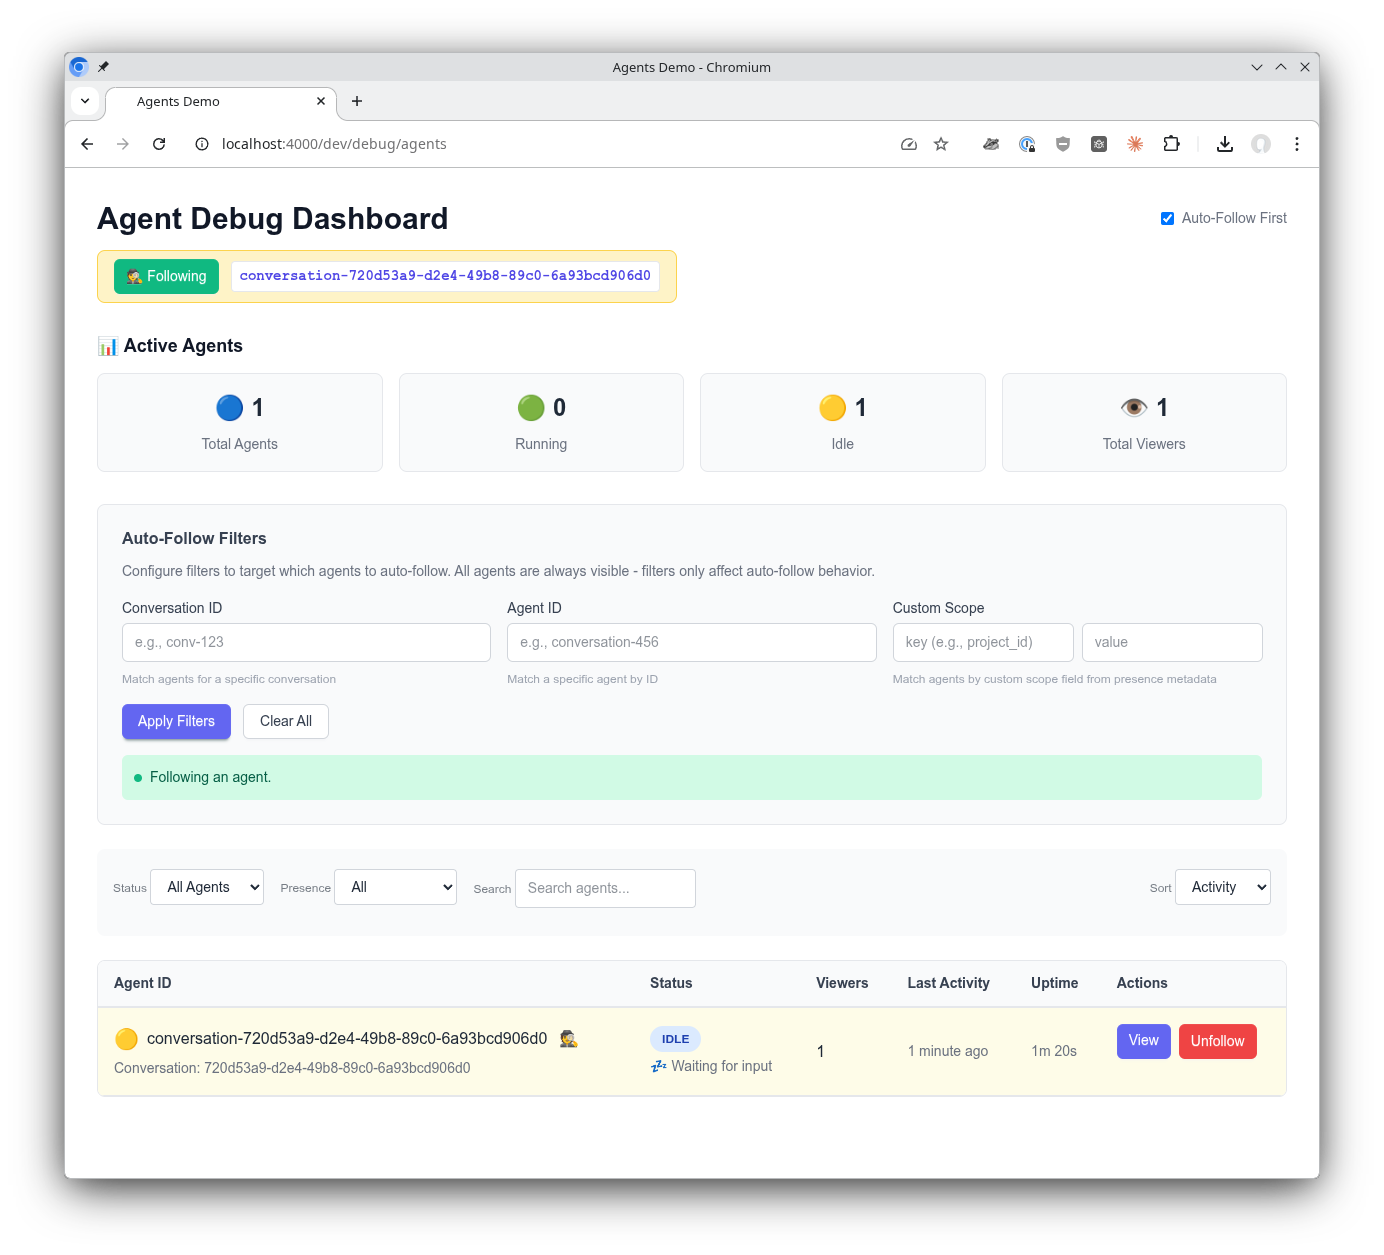
In development mode, the debugger automatically follows the first agent that appears. This eliminates the need for manual agent selection during local development.
Toggle auto-follow using the checkbox in the header, or configure the default in your application's config:
# To disable auto-follow by default (e.g., in production)
config :sagents_live_debugger,
  auto_follow_default: false
Note: The library defaults to dev-friendly settings (auto-follow on). You only need to add config to change this default.
Get insights into the message exchange from the perspective of the agent. Middleware is used to build the system prompt for your agent. See exactly how the agent is configured quickly and easily. Browse the complete message history including tool calls, tool results, and thinking blocks.
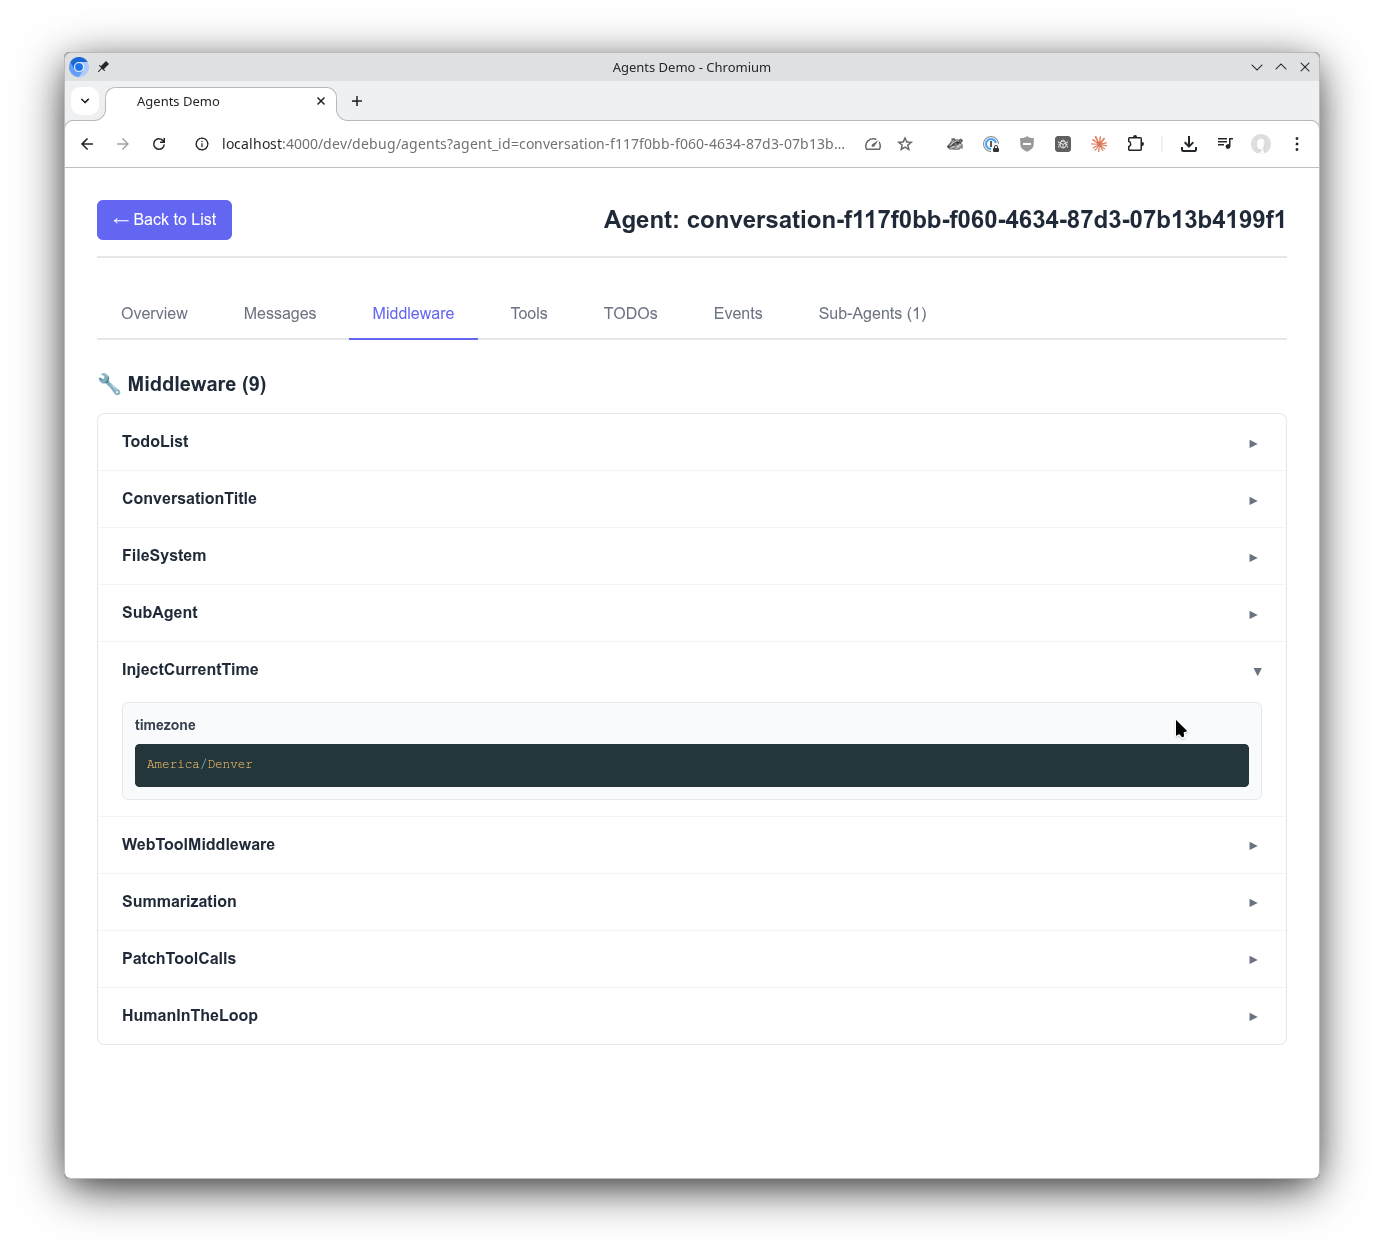
A significant feature of Sagents is how middleware makes an agent's abilities composable and powerful. See the middleware your agent was configured with and explore the configured settings for each middleware.
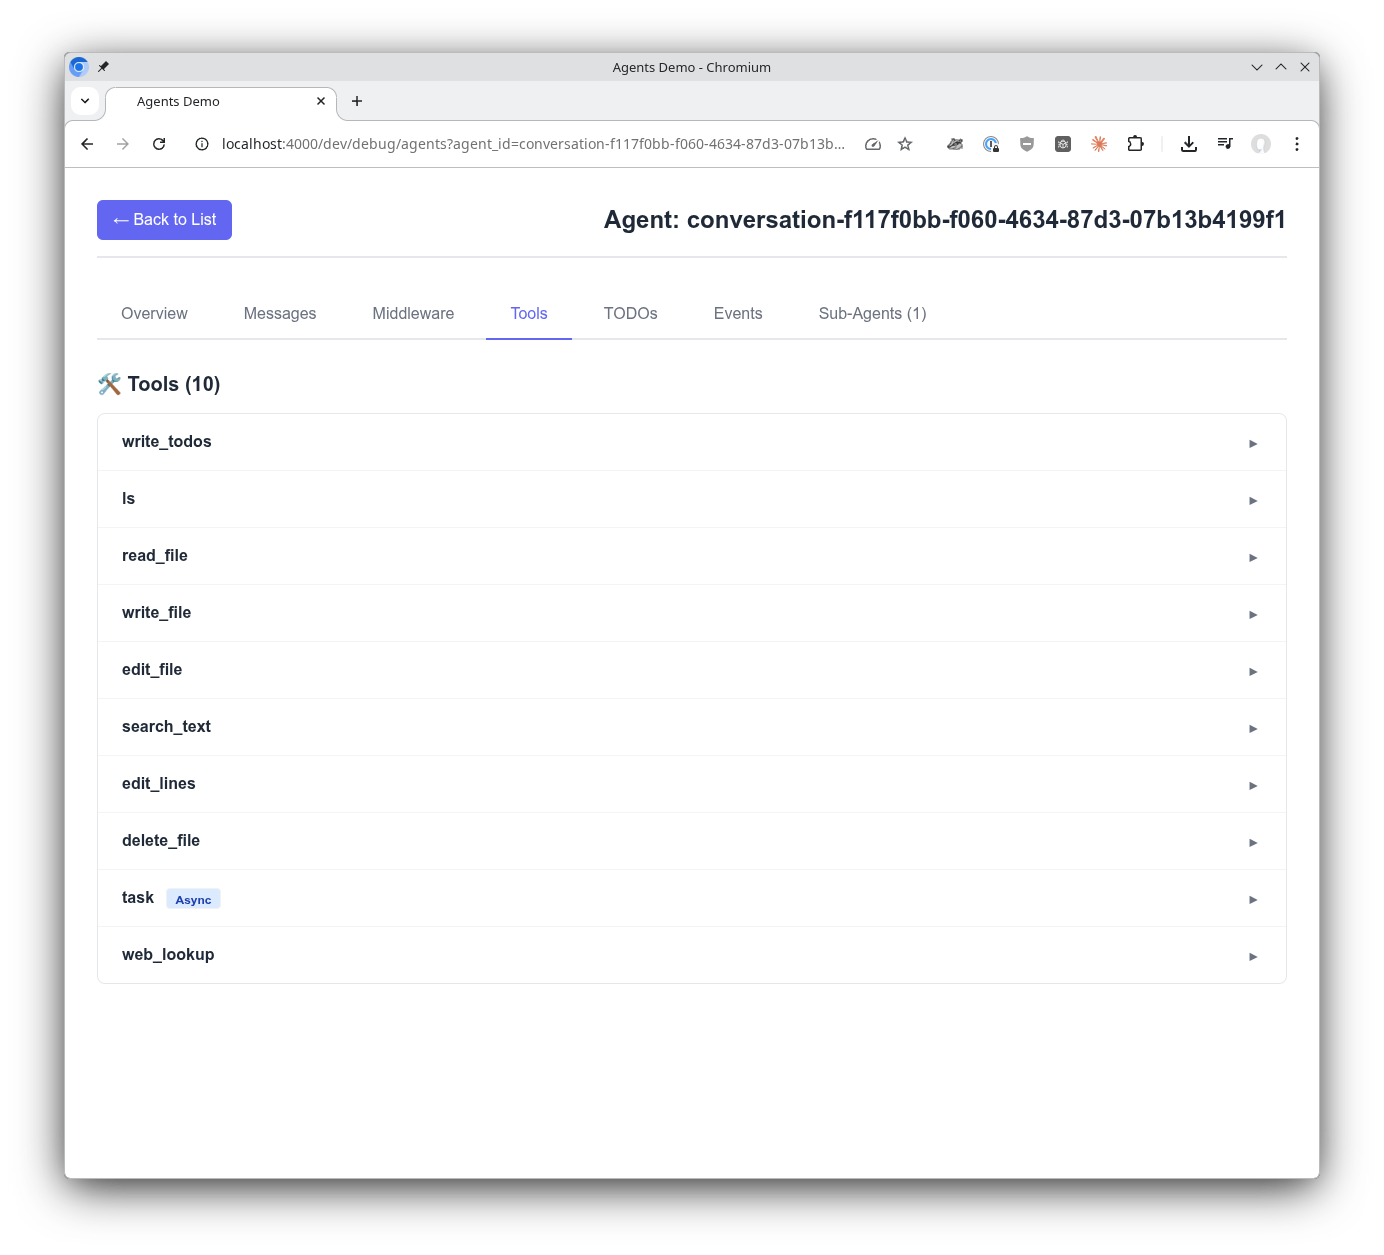
Tools are the way agents get things done. See all the tools, their configuration, and instructions to the agent revealed in one easy location.
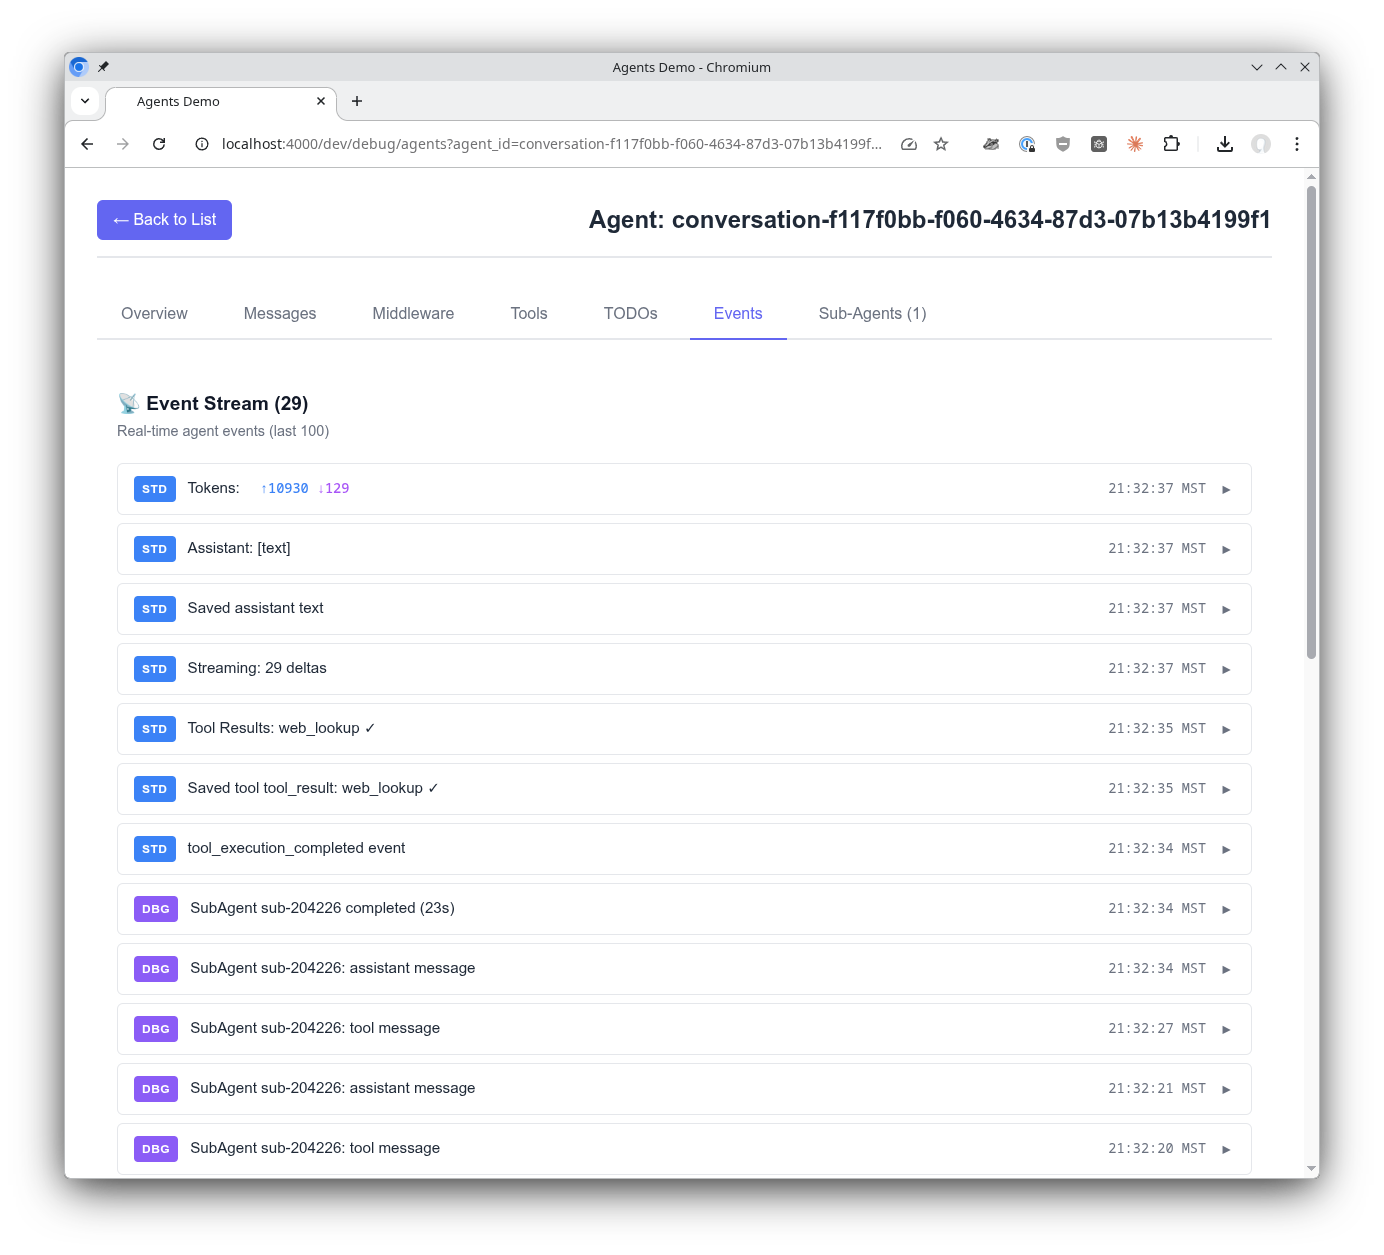
When working with agents, being able to see the stream of events they are receiving and emitting is incredibly valuable. The SagentsLiveDebugger subscribes to the additional and optional debug event stream to give even greater insights into what's happening with your agent.
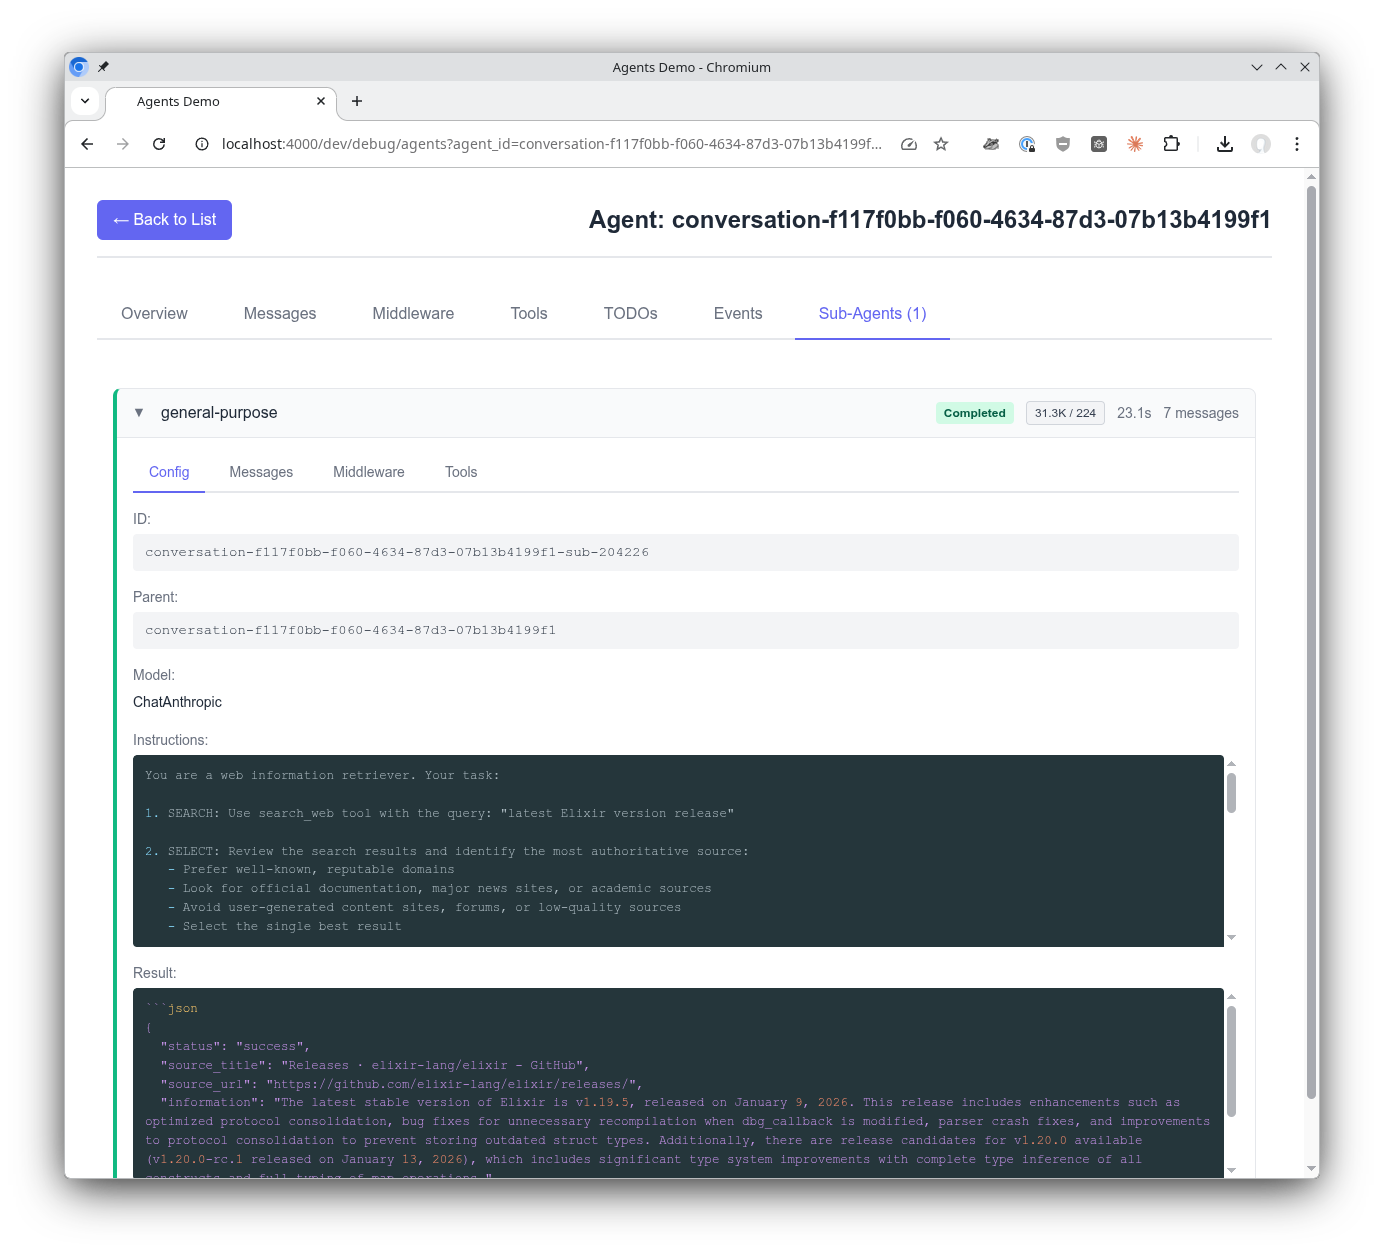
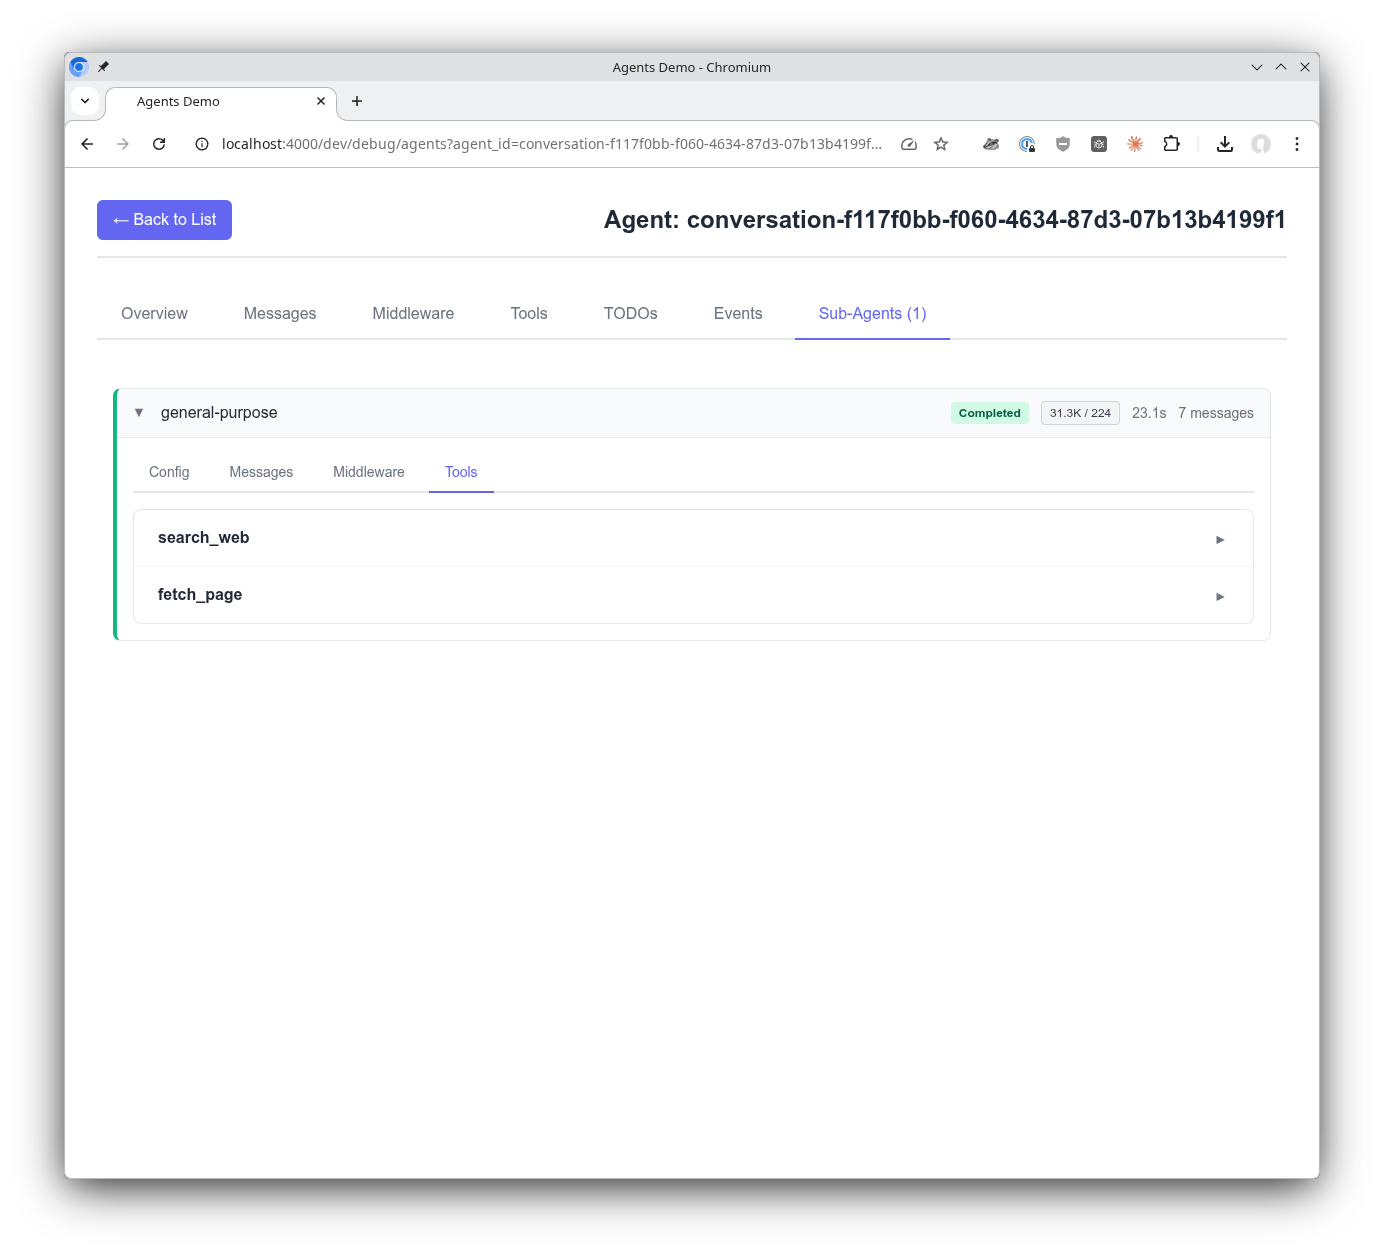
When an agent spawns sub-agents (via the Task tool), they appear in the Sub-Agents tab with full visibility:
- Lifecycle Events: Started, status changes, completion, errors
- Real-time Streaming: See LLM responses as they stream
- Configuration View: Instructions, tools, middleware, model
- Messages View: Complete conversation history
- Duration Tracking: Execution time for each sub-agent
Sub-agent events are automatically broadcast through the parent agent's debug topic, requiring no additional configuration.
Getting insight into sub-agents is critically important. Sub-agents are launched by the main agent when it determines they are needed. They receive their instructions from the main agent and return their response back to the main agent. This visibility into sub-agents helps you confirm the system is working as expected, or reveals issues where something isn't configured correctly.
See what instructions a sub-agent received from the main agent and what its response was. This reveals the full picture of the delegation: what was asked and what was returned.
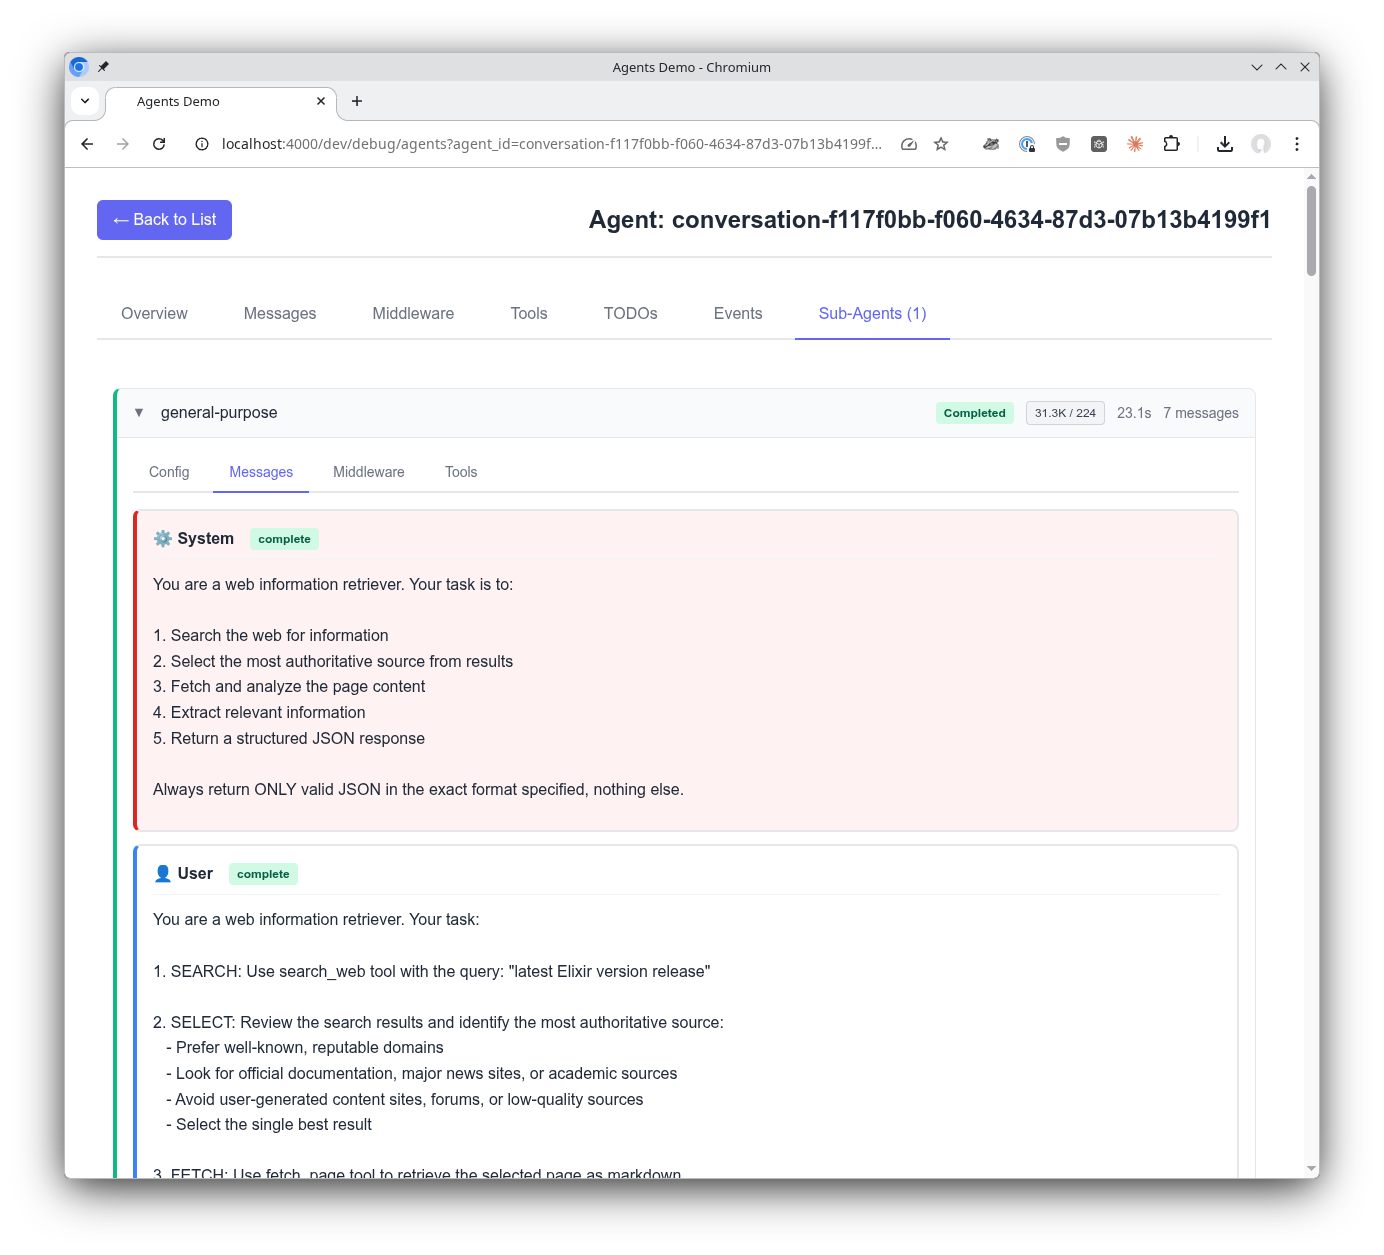
View the multi-turn conversation a sub-agent has as it uses tools and works towards an answer for its task. Follow the sub-agent's reasoning step by step.
See the tools a sub-agent has access to in order to do its work.
The debugger is designed as a self-contained plugin library:
- No JavaScript or CSS files for the host application to compile or bundle
- CSS and JS are read at compile time and served from cache-busted Plug routes (
/css-<md5>,/js-<md5>) with long-lived immutable cache headers, mirroring thePhoenix.LiveDashboardpattern - Browser timezone is pushed through the LiveSocket
connect_paramson connect and validated server-side againstTzdata - Zero configuration beyond adding to the router, with optional CSP nonce support for strict-CSP host apps
The debugger is entirely event-driven (no polling):
- Agent List: Built from presence metadata, updates via
presence_diffevents - Agent Detail: Real-time updates via PubSub subscriptions
status_changed- Status updatestodos_updated- Todo list changesllm_message- New messages{:subagent, id, event}- Sub-agent events
- Sub-Agents: Events broadcast through parent agent's debug topic
AgentServer                    Debugger (LiveView)
    |                               |
    |-- presence track ------------>|  Agent appears in list
    |                               |
    |-- {:debug, event} ----------->|  Debug events stream
    |                               |
    |                               |
SubAgentServer                      |
    |                               |
    |-- via parent.publish_debug -->|  Sub-agent events
    |                               |
Automatic timezone detection for the event display uses Intl.DateTimeFormat().resolvedOptions().timeZone, which is supported in:
- Chrome/Edge 24+
- Firefox 52+
- Safari 10+
Older browsers will gracefully fall back to displaying timestamps in UTC.
The debugger uses dev-friendly defaults out of the box. For production deployments, add configuration to your application's config files:
| Setting | Default | Description |
|---|---|---|
auto_follow_default |
true |
Auto-follow first agent that appears |
Example production configuration:
# config/prod.exs in YOUR application (not the library)
config :sagents_live_debugger,
  auto_follow_default: false
With production settings, users must manually select agents to follow.
Apache-2.0 license - see LICENSE for details.