Conversation
|
To validate this pull request against other sbt modules, please visit this link. |
|
@lukaszwawrzyk Thanks for the contribution! These changes looks great. |
|
@eed3si9n Thank you! When I get a bit more time I will prepare this PR for review and merging. |
6381827 to
9a23c95
Compare
|
@eed3si9n Ok, I guess this PR is ready for review. |
 jvican
left a comment
jvican
left a comment
There was a problem hiding this comment.
The changes here look great to me! The only controversial thing is that you only print the things that changed in the API, and not the context. Could you actually add some kind of flag to disable this behavior? The default in your PR is just fine, I just want a way to check all the file so that I don't have to look at the file myself to understand a diff 😄
|
@jvican Since I created this PR I spent some more time looking at logs. It seems like the code that creates this diff can kind of get lost and show something that is not very readable or accurate. When the unchanged lines are removed from that it is impossible to understand what happened. For this reason I'd rather completely remove this feature from this PR and maybe investigate it later. I also found more things. One is that for clean compilation (when Pruned is empty), Fresh and Merged are identical, so we don't need to display them both, just show something like "Fresh == Merged" and then print the relation. Other than that there are more things to color that I missed - the invalidation information. I didn't yet do it for all variants of it, but I plan to update PR when I have little more time. |
This reverts commit 0bc115a.
4950082 to
7d72fa6
Compare
|
So, I reverted showing only changed lines on the diff. I added this check to avoid logging both Fresh and Merged if they are equal. I dropped the I changed I refromatted and colored output for initial invalidation also adding this multiline thing because paths to source files tend to be longer and hard to read in one line. I also did some slight improvements to the rest of invalidation output. I am not happy with the last changes, I mean I'd like it to look better but I don't know how to make it better currently. Perhaps when I will have to debug the invalidation logic more it will become more apparent to me. But regardless I think this PR still helped logs a lot and apart from things I shall do as a requested reworks before merging this I don't plan to add anything more now. Maybe when I get more ideas I will revisit this problem of readable logs later on. |


|
I think this is an area where we could immensely benefit from better tooling, and I'm not sure logging is the best way to approach this problem (though the changes in this PR are great). Logs are useful for debugging, but most realistically this debugging will be done by maintainers of the repository that are already familiar with the internals, so bad-formatted output can be born. What if, instead, we try to make this output be more useful than just debugging concrete problems? My dream as a maintainer would be that we use this data to try to reproduce complicated incremental compiler bugs. We don't have reports of these bugs nowadays, which is good on the one side but concerning on the other one: debugging Zinc is difficult, requires concrete knowledge, and most of the bugs happen while software developers try to fix a bug or ship features in their applications. What if people are just ignoring incremental compiler errors and cleaning their builds when they happen? I'm pretty certain this happens to some extend, so diagnosing problems with the incremental compiler in an automatic or semi-automatic way would be a big win. What I have in mind is the possibility of adding an internal Zinc module that would serialize all the incremental compiler debug data shown in the terminal to a protobuf file (or possibly the same analysis file) -- the most important part is that the contents of this file are accessible in memory to the build tool in case it wants to use it. The protobuf file would contain all data about the incremental compiler runs. The idea would be that people that just run into a normal incremental compiler error like I think this approach could be more interesting than just prettifying the debug output of the incremental compiler and would have far-reaching positive consequences in our community. @lukaszwawrzyk What do you think about this idea? Would you like to contribute it to Zinc? |
|
I decided to quickly implement a prototype of this idea, so I'll submit a PR soon. @lukaszwawrzyk if you still want to work on this area, you have complete freedom to write a beautifier on top of the protobuf data to show it to the console in the best possible way. |
zprof is the name I've chosen for this small profiler (or tracker if you
will) of the invalidation logic. The profiled data is formalized in an
internal format that is not supposed to be used by normal users, but
rather by us (Zinc) and related tools (Bloop).

The current profiled data exposes details of how the incremental
compiler works internally and how it invalidates classes. This is the
realization of an idea I registered here: sbt#550

With this idea, this data will not only be useful for debugging but for
providing an automatic way of reporting bugs in Zinc. The infrastructure
is far from finished but it's already in a usable state for libraries
that depend on Zinc directly and have direct access to `Incremental`.

By default, no profiler is used. Only people that change the profiler
argument for `Incremental.compile` will be able to get the run profiles.
|
is there any chance of this progressing? or should we just close it? |
Exactly. I would say I experience under-compilation errors about once a week. Most of the time it is some changes not forcing enough recompilation, esp. after refactoring, like changing class to trait, or replacing implicit class with extension. Actually those are easy to solve, you just clean the build and go on. There is also over-compilation, like my recent #1396 - and those are even worse in my opinion, as it is often hard to be sure what you see is a bug. While under-compilation results in error, which is something solid and unavoidable, over-compilation is not that clear, things just take longer, but how should one know how long they need to take? As you can see on this particular example, knowing what compiles and why is quite complicated at the moment.
While this sounds awesome, do not let perfect be enemy of good. Any improvement of the debug output to make it more practical and easier to read is welcome. |
Yeah... it also doesn't help that there's only a handful of people in the world who are semi-actively solving under-compilation issues. Would appreciate bug reports on any consistently reproducible under-compilation issues!
This is an especially challenging issue. Zinc has complex states and very dense invalidation logics that makes knowing what compiles and why a difficult task. Whenever I am debugging Zinc issues I have to use Active Debugger almost all the time. Unfortunately I cannot think of a good solution to this problem other than a complete refactoring of Zinc internal to clean up invalidation logics.
I will give this PR another look when I have spare time. I do remember me forking the PR branch and was placing around with it a couple months ago. However I encountered some problem with color codes and couldn't quite figure out how to fix them. Your tip of "do not let perfect be enemy of good" is really inspiring though and I guess in worst case I will just try to first get a subset of the PR changes to main branch as that would still be good changes to have. |
I have just experienced a few under-complilation issues caused by refactoring my project, mostly replacing |
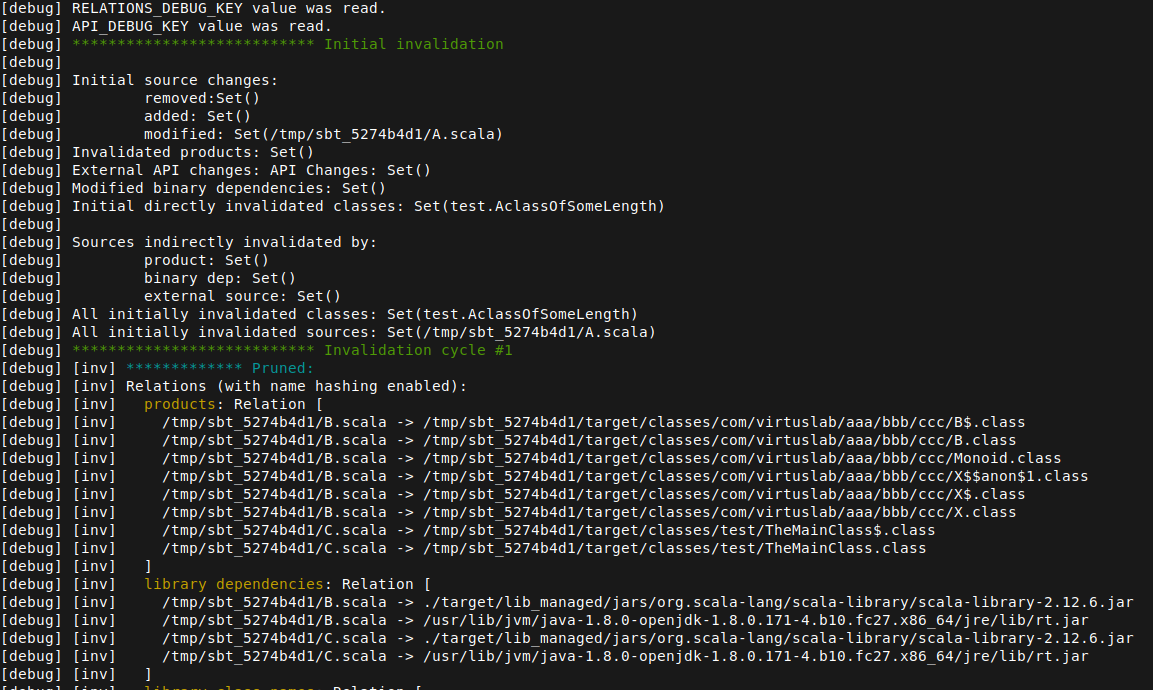
I am working on improving the debug logs (#338). I changed a couple of things
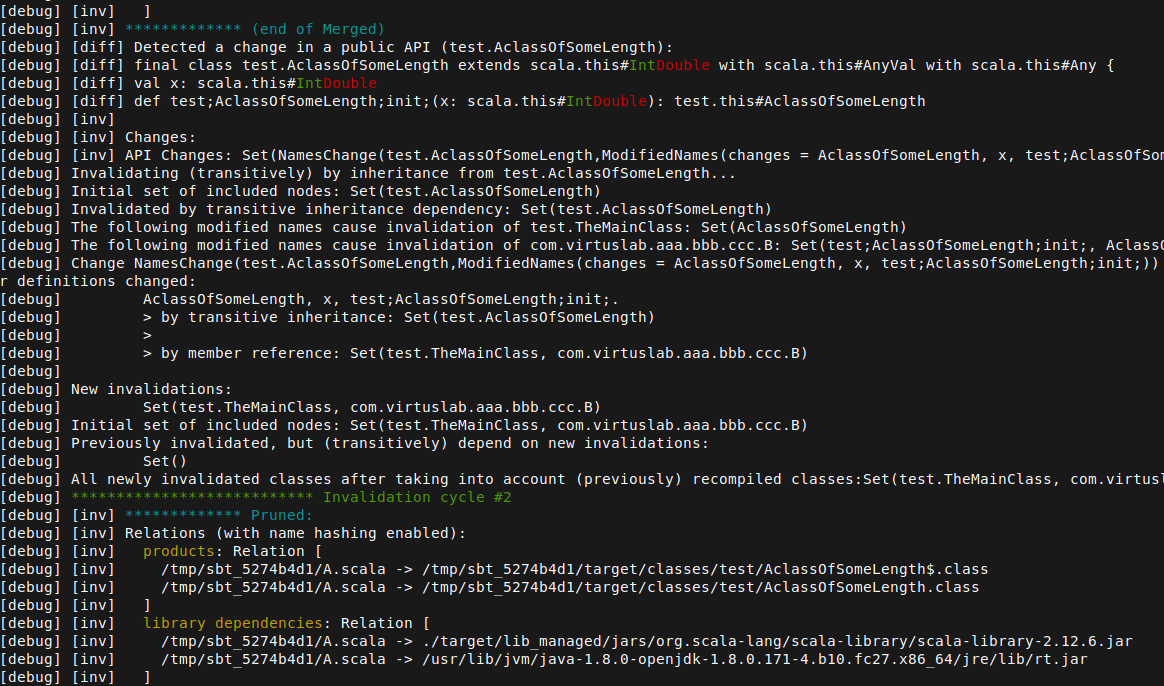
diff
There is this diff thing displayed for interface changes. "Detected a change in a public API" and so on. Most of the lines there are not changed. Also there and those things that are always present and quite ugly like:
What I done here is to only display lines with changes. I am not 100% sure about that change though as if there is a class and companion object, this context can be lost if those lines are unchanged.
UsedName
I noticed it kind of clutters the log, especially used in Relation. It prints like
UsedName($this,[Default]), while the scopes are almost always (I actually could not get it to be something else than singleton set with Default scope) the same. I replaced it to simply display$this. The actual scopes would only be displayed if they are something else e.g.$this [Default, implicit].Pruned, Fresh, Merged
I added colors to those section markers and information at the end about which section ended. Similarly to #407
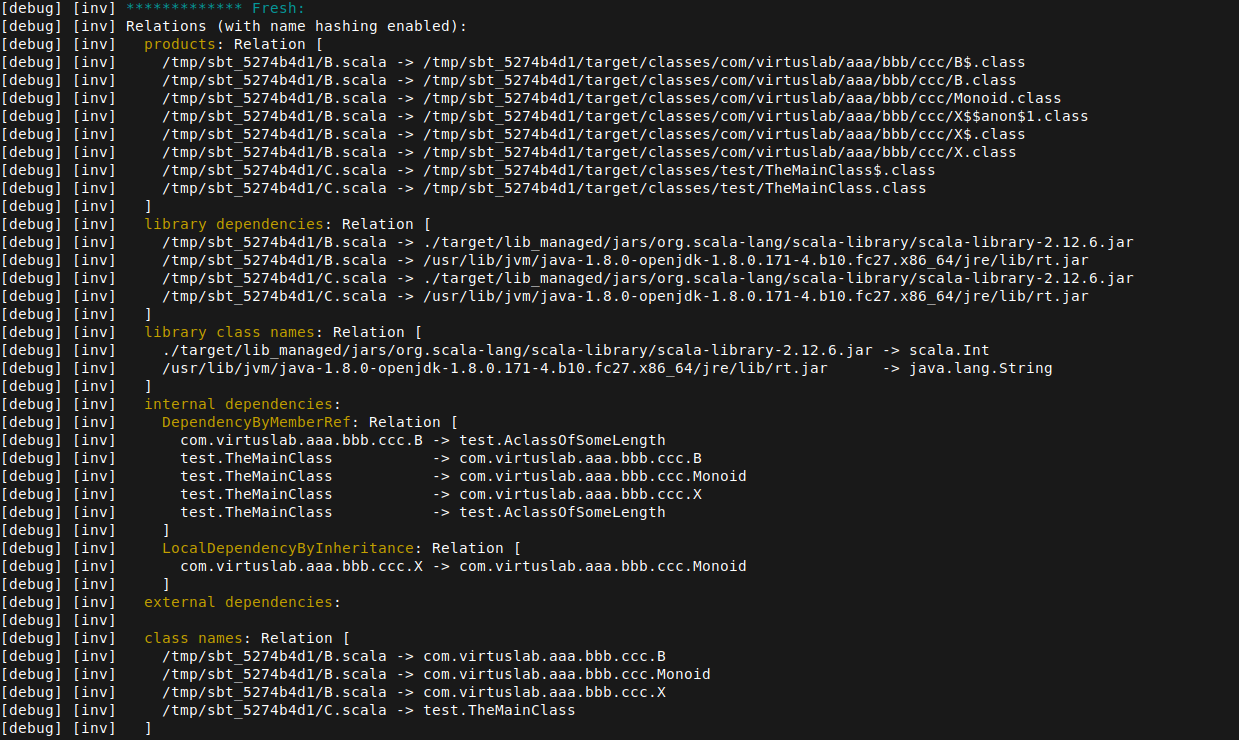
Vertical alignment
I implemented vertical alignment for relations i.e. something like:
This happens in scope of single relation
Indentation in relations
I added proper indentation when printing a Relation. Before the
]was always at the beginning of the line and members were indented with 4 spaces. Now everything is indented according to nesting level (as there also are relations inside relations), by 2 spaces.MRelationsNameHashing
The main thing that is printing relations for products, library dependencies, class names, used names, etc. I added colors for names of those relations (also similar to #407)
Cycles
One more thing I found difficult to identify is which compile cycle the logs belong to and where it starts, so I added a log message to show those.
I used different colors for everything. Maybe it is too much, but I think it is easier to scroll through logs like that.
I am open to any suggestions on how to improve this. Also, don't worry about the messy code, I will refactor it once the code looks as intended. I primarly would like to hear some opinion or suggestions.
I am adding some screenshots: