UK Unemployment Figures 2013 - 2022
From Statistics at DWP I downloaded data-tables-alternative-claimant-count-jan-2013-to-aug-2022.ods to see if I could manipulate some government data. Only up to 2022 is covered as "this is the final release of this statistical series. The majority of unemployment-related benefit claimants have now migrated to Universal Credit". However, this limited time range does cover the Covid pandemic of which the effects on the number of benefit claimants is clear. It is also clear that neighbouring councils can have stark differences in unemployment numbers.
The dashboard has three pages:
-
Page 1 (By region) shows how this is distributed over the UK regions and can be filtered by year and month over 2013 to 2022 for each region, as well as the whole UK.
From this, a spike in the numbers from 1.4 to 2.6 million, March - May 2020, due to Covid is clear. -
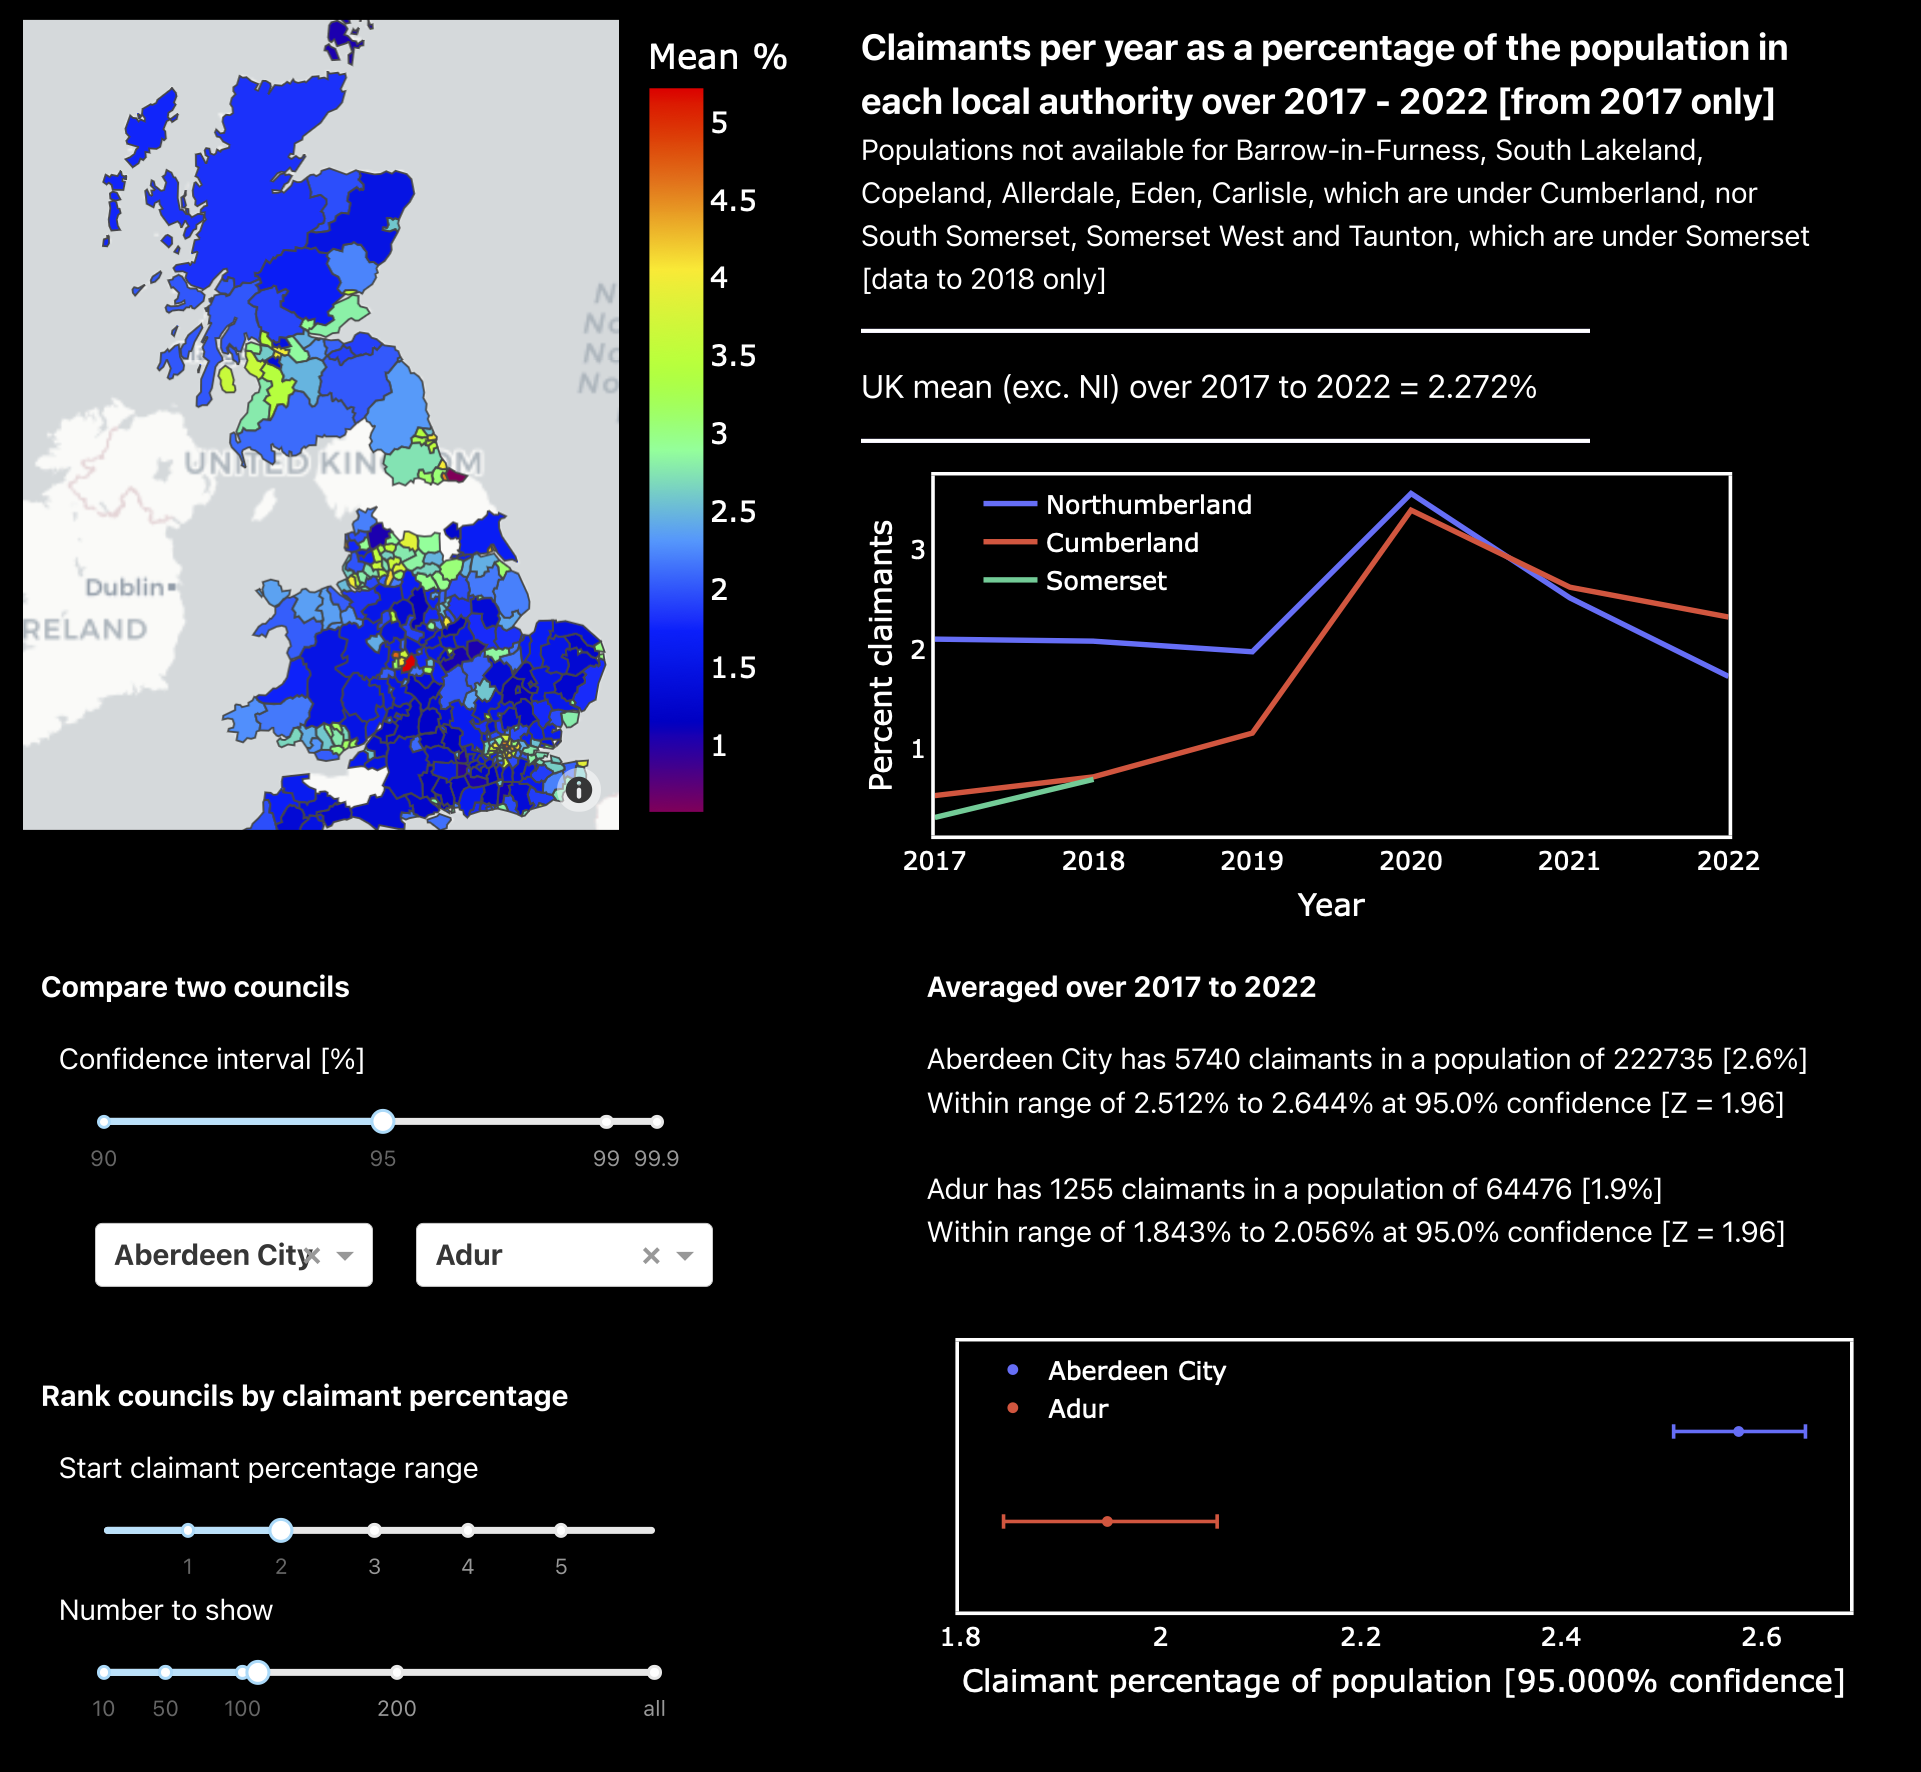
Page 2 (By council) shows the figures for each of the 374 UK councils - excluding Northern Ireland for which the data were not included. Also, the council data start in 2017.
Hovering over the map shows how the numbers change of 2017-2022 for that council, which is broken down into two age groups (based on the 16-24 years given in the original spreadsheet).
There is also a table showing how much the council contributes to the UK total, as well as the lowest, highest and median values. -
Page 3 (Comparisons) combines the above data with population date from further databases for England plus Wales and Scotland. This is used to obtain the percentage of unemployed for each council.
The spreadsheets in different formats, each of which is processed by the code. Also, some councils have slightly different names from the original spreadsheet, which have also been accounted for. There are still some councils which have been amalgamated over the time span of the data. Averaging of these, e.g. Barrow-in-Furness, South Lakeland, Copeland, Allerdale, Eden, Carlisle, into Cumberland, were considered but the numbers would have been misleading. Instead these are shown in a plot along with the highlighted council.
With the normalisation of the data, we can compare unemployment
rates between councils, which can be quite stark between neighbours.
E.g. Redcar & Cleveland (0.57%) and Middlesbrough (4.5%, averaged
over 2017 to 2022) in the north east of England. Adjusting the
significance of the Wilson score, these numbers remain very different
at the > 99.99% confidence level.
Although the City of London has the lowest unemployment figures in
the country, this is driven by the small sample number with the
rate being 2.1+/-0.3% over 2017 - 2022 (95% confidence).
Birmingham has the highest rate, at 5.8+/-0.1% (95% confidence), although this overlaps with Hartlepool and Middlesbrough (95% confidence), for the years 2017 to 2019, and Hackney and Haringey for 2021 and overtaken by Newham in 2021, before taking the lead again in 2022 (5.7%).
The dashboad is acessible at http://steviecurran.pythonanywhere.com - the page may require a reload and is quite slow to load (that's the basic package for you!)