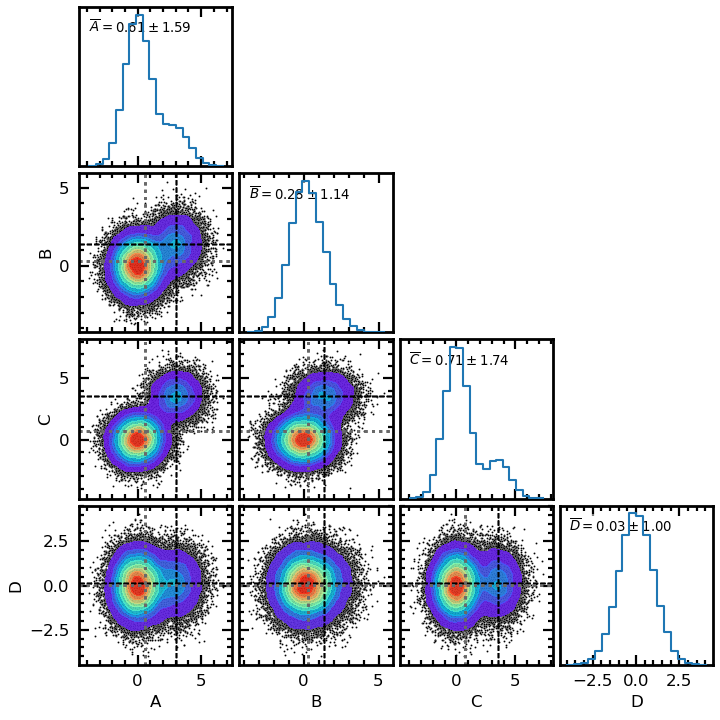
Produces a similar plot to corner, which shows the projections of data in a multi-dimensional space. This uses seaborn to produce a more adjustable, 'publication ready' plot e.g. through variable axis thickness, the use of colour maps, line styles, choice of contours/density maps and order of plotting in relation to scatter plot. Also included is an option to save a hard copy in the required format.
pip install scorner
from scorner import scorner
scorner.scorner(data)
where data is an array or dataframe
See src/scorner/demo.ipynb for examples
Parameters
----------

data : obj

    The data in the form of an array or dataframe.

cols: list

    If data input as array this specifies the column names of the
    dataframe (required by seaborn).

true_values: list

    The mean values used to generate the data. Default is not to
    show.

true_style : list
    Line style, width and colour if showing true_values

test_run : bool

    If True a test using test_no rows of the dataframe will be
    run.  Since sns.kdeplot can take a while to run, this is
    advisable until the plot appearance is satisfactory. Default
    is to run the whole dataset.

test_no : int

    The number of rows which test_run will use. Default is 500

bins : int

    The number of histogram bins

cmap : str

    The colour map of the density plot. Default is 'rainbow'
    https://matplotlib.org/stable/users/explain/colors/colormaps.html

fs : float

    Specifies the font size, which scales with the height of the plot

xlabel_off : bool

    If True this removes the x-axis labels. If False the dataframe column
    names are used

ylabel_off : bool

    If True this removes the y-axis labels. If False the dataframe column
    names are used

height : float

    The height of the plot according to seaborn. The default is 1.5

aspect : float

    The aspect of the plot according to seaborn

aw : float

    Axis widths, the default is 2

ap : float

    Axis padding, the default is 7

point_s : float

    Point size in scatter plots

point_c:

    Point colour in scatter plots

lrot : float

    Axis label rotation angle, default is 0

min_space : int

    Number of minor ticks per major tick interval. Default is 5

dens : bol

   If True this will plot a density maps using the specified colour map.
   Default is True

dens_alpha : float

   The transparency of the density map. Default is fully opaque (alpha = 1)

con : bol

  If True this will show a contour map. Default is no contour map

con_levels : int

  The number of contours

con_thresh : float

  The lowest contour value

show_stats : bool

  Show the mean and standard deviation in the histogram. Default is False

stats_in : bool

  If True (default) the above legend is shown within the histograms. If
  False it is show above the histograms

leg_scale: float

  If show_stats=True, the size of the legend font in relation to the tick font

leg_dps : int

  If show_stats=True, the number of decimal places to show these to

leg_alpha : float

  Transparency of legend box if stats_in = True. Default is 0.5

leg_fc : str

  Colour of legend box if stats_in = True, Default is 'w'

tlp : float

  The plt.tight_layout pad value, the default is 0.3

hc : bool

  hc = True saves a hard copy. The default is False

plot_form : str

  The format of the hard copy, the default is 'png'

plot_name : str

  The name of the hard copy, the default is 'scorner'