Code to extract trend line from a graph
Similar to DataThief, which is great, but not always practical when the data are messy
After defining coordinates on your plot a trend line can be fit and its coordinates converted to those of the image, allowing you to use this is an overlay on another image.
The steps are:
- Choose directory and read in image
- Define reference points on plot
- Annotate lines and adjust to coincide with the reference points
- Overlay and adjust polyline to coincide with data points
- Output array containing the transformed polyline coordinates which can be overlaid on your own plot
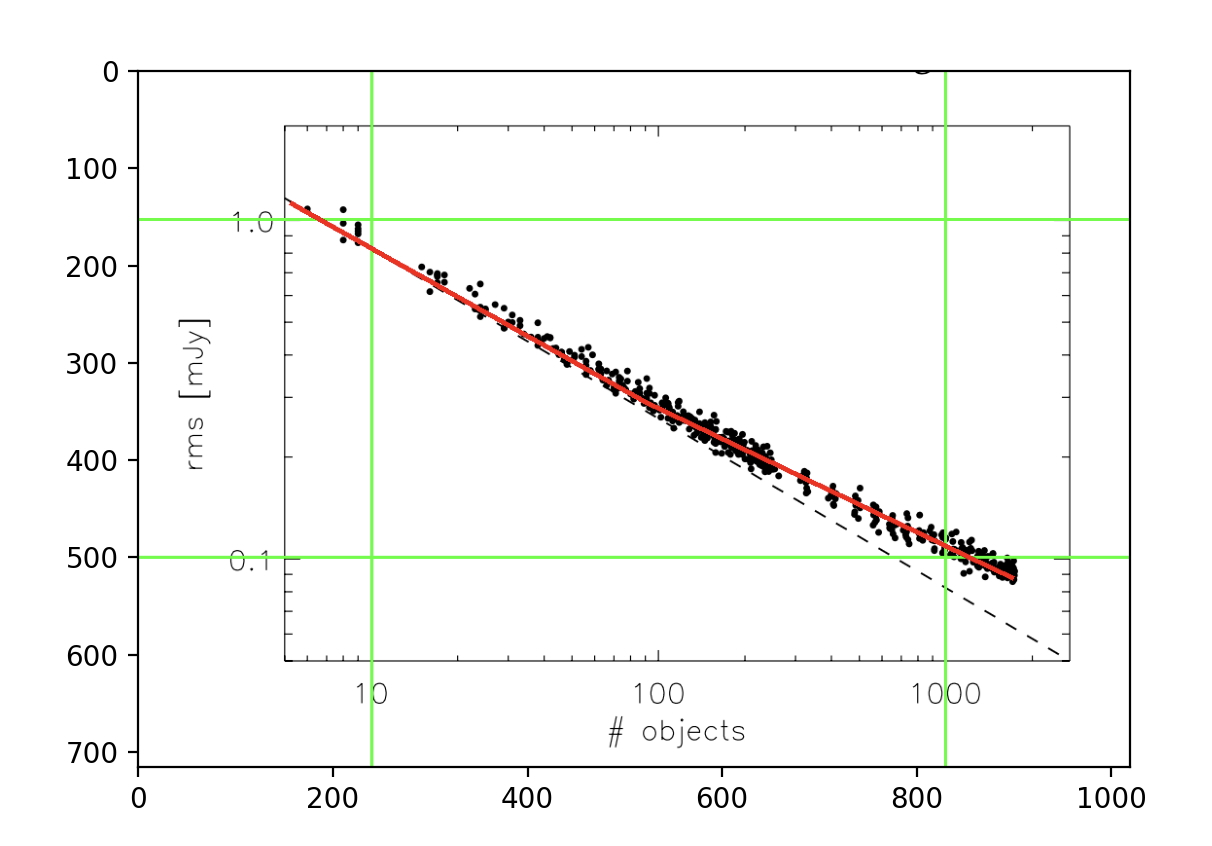
The test image, fgc+11_Fig5.png' from ALFALFA H I data stacking – I. Does the bulge quench ongoing star formation in early-type galaxies? for which the code was originally written, since the data points are fairly indistinguishable and the trend is not straight.