
Modern, performant, and highly customizable chart library for React Native built with Skia. Supports iOS, Android, and Web with smooth animations and interactive features.
📖 Documentation + Demos
·
💡 Vote on the Roadmap!
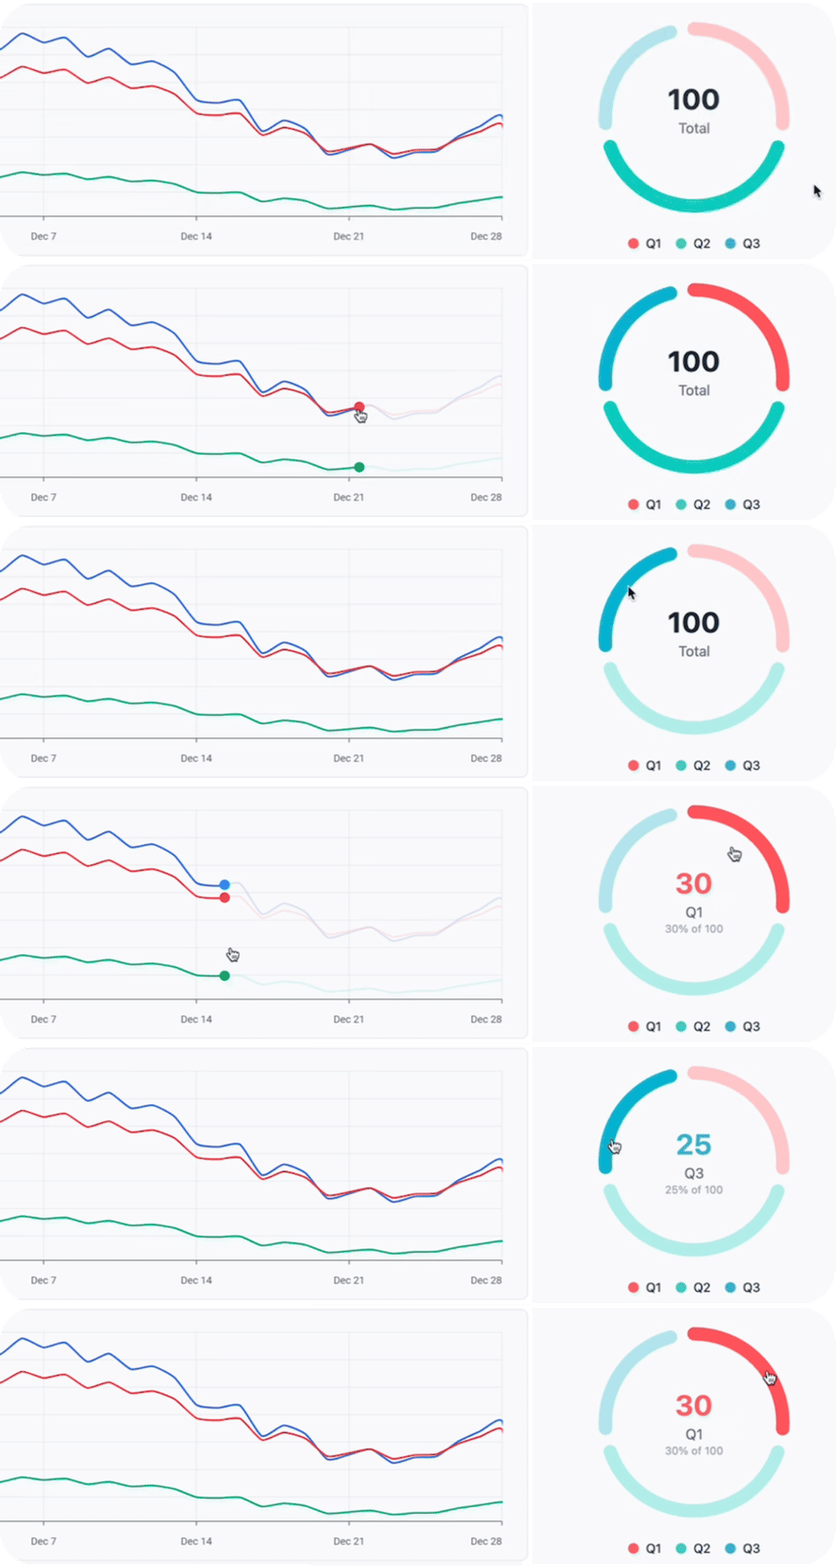
- High Performance: Built on top of react-native-skia for native rendering performance
- Smooth Animations: Powered by react-native-reanimated for 60fps animations
- Interactive: Touch and hover interactions with customizable tooltips
- Cross-Platform: Works on iOS, Android, and Web
- TypeScript: Full TypeScript support with comprehensive type definitions
- Customizable: Extensive configuration options for styling and behavior
- LineChart: Single and multi-line charts with smooth curves, area fills (gradient/solid), axes, grid lines, and interactive tooltips
- BarChart: Vertical and horizontal bar charts with grouped/stacked modes, hover effects, rounded corners, and custom tooltips
- DonutChart: Donut and pie charts with hover effects, legends, custom center values, and segment gaps
This library is built on top of the following peer dependencies:
@shopify/react-native-skiareact-native-reanimatedreact-native-workletsreact-native-gesture-handler
Important: react-native-skia requires react-native@>=0.79 and react@>=19. See the compatibility documentation for details.
If you don't have the required dependencies installed yet:
npx expo install @shopify/react-native-skia react-native-reanimated react-native-worklets react-native-gesture-handlerWeb Setup: If you haven't used react-native-skia before, follow the manual web configuration guide.
npm install expo-skia-charts
# or
yarn add expo-skia-chartsimport { LineChart } from "expo-skia-charts";
function MyChart() {
const data = [
{ x: 1, y: 20 },
{ x: 2, y: 35 },
{ x: 3, y: 25 },
{ x: 4, y: 45 },
{ x: 5, y: 30 },
];
return (
<View style={{ height: 300 }}>
<LineChart
config={{
series: [
{
id: "series1",
label: "Revenue",
data: data,
},
],
xAxis: { enabled: true },
yAxis: { enabled: true, showGridLines: true },
hover: { enabled: true, showDot: true },
}}
/>
</View>
);
}import { BarChart } from "expo-skia-charts";
function MyChart() {
const data = [
{ label: "Jan", value: 65 },
{ label: "Feb", value: 59 },
{ label: "Mar", value: 80 },
{ label: "Apr", value: 81 },
{ label: "May", value: 56 },
{ label: "Jun", value: 55 },
];
return (
<View style={{ height: 300 }}>
<BarChart
config={{
data: data,
orientation: "vertical",
style: { cornerRadius: 8 },
yAxis: { enabled: true, showGridLines: true },
xAxis: { enabled: true },
hover: {
enabled: true,
tooltip: {
renderContent: (dataPoint) => (
<View
style={{
backgroundColor: "white",
padding: 8,
borderRadius: 6,
borderWidth: 1,
borderColor: "#e0e0e0",
}}
>
<Text>{dataPoint.label}</Text>
<Text style={{ fontWeight: "bold" }}>{dataPoint.value}</Text>
</View>
),
},
},
}}
/>
</View>
);
}import { DonutChart } from "expo-skia-charts";
function MyChart() {
const data = [
{ label: "Design", value: 50000 },
{ label: "Development", value: 25000 },
{ label: "Marketing", value: 10000 },
];
return (
<View style={{ height: 350 }}>
<DonutChart
config={{
data: data,
strokeWidth: 25,
gap: 5,
roundedCorners: true,
centerValues: { enabled: true },
legend: { enabled: true },
hover: { enabled: true, animateOnHover: true },
}}
/>
</View>
);
}- I appreciate any contribution, feel free to open a PR. I will gladly merge it.
MIT
Made with create-react-native-library