
In this project, NLP is used to attempt to predict Tesla Stock movement based on sentiment from articles about the stock from the New York Times.
We have all heard at some point about the magic of the Stock market, transforming investments into fortunes for those that dare take the risk. Many investors and institutions study, observe and gather data on stock to gain any edge that they can in order to provide a strong and reliable stock trading strategy. Similar to a casino, gaining any edge over 50% could lead to great rewards.
Lately, given the volatility of the stock market, especially during the COVID-19, many opportunities have presented themselves. The stock market experienced an influx from the stimulus packages and a wave of retail traders followed. According to a study, more than 10MM new brokerage accounts were opened in 2020 - more than ever in a year. We have seen stocks such as GameStop, Moderna, Wayfair, Peloton and many more gain enormous amounts of market cap. For this project, I decided to pick one of people's favorites and as well as a large winner from Covid-19- Tesla. Tesla has increased its price from its Covid low of around $72 to its current price of $753 as of Tuesday, September 9 close.
Tesla remains one of retail traders favorites (currently sits as the second most traded stock on Robinhood, a favorite trading platform for retail traders.) Because of the gap of information between large institutional traders and the retail traders. I have formed a hypothesis that the average retail trader would be more likely to react to both positive and negative sentiments regarding the stock itself.

To try and prove this, this project attempts to use NLP's Sentiment analysis tools to solve a classification problem. Given an article/tweet released about Tesla, my classifier model will attempt to predict wether the stock would close up or below the open price for that day.
Articles URLs were obtained from the New York Times API and then paired with beautiful soup to scrape the body of the articles. https://developer.nytimes.com/docs/articlesearch-product/1/overview
The Article Search API of The New York Time was queried for articles containing the term 'tesla' 2010 (Tesla IPO year) and 2021. The search term returned a total of 3,220 article hits.
1000 Elon Musk tweets were used ranging from 2015-2020
The API returned the following information for each article:
- URL
- Snippet (Headline)
- Publication Date
- Identifier
- Lead Paragraph
The body of articles were obtained from webscraping using beautiful soup.
Tweets were obtained via https://www.kaggle.com/andradaolteanu/all-elon-musks-tweets
NASDAQ price were obtained from Yahoo Finance.

Natural Language Processing (NLP) was applied to each article snippet (headline), lead paragraph and article body. Two sentiment analysis toolsets were applied to the article texts.
Two NLP tools were used in this analysis:
TextBlob Sentiment Analysis https://textblob.readthedocs.io/en/dev/
TextBlob Sentiment Analysis tool was applied to the snippet (headline), lead paragraph and article body of each article. Form there, Polarity and subjectivity scores were recorded for each article.
- Polarity: a float which lies in the range of [-1,1] where 1 means positive statement and -1 means a negative statement.
- Subjectivity : a float between [0,1] where 0 refer to factual information and 1 indicates that it is total public opinion
VADER ( Valence Aware Dictionary for Sentiment Reasoning) is a model used for text sentiment analysis that is sensitive to both polarity (positive/negative) and intensity (strength) of emotion. It is available in the NLTK package and can be applied directly to unlabeled text data.
VADER sentimental analysis relies on a dictionary that maps lexical features to emotion intensities known as sentiment scores. The sentiment score of a text can be obtained by summing up the intensity of each word in the text.
Vader sentiment intensity analyzer was used to break down the lead paragraph and headline fo each article. The polarity_scores method was used to obtain the following :
example:
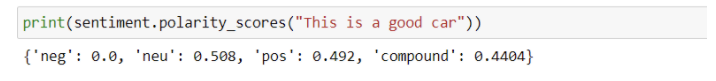
- postive
- negative
- neutral
- compound= The compound score is the sum of positive, negative & neutral scores which is then normalized between -1(most extreme negative) and +1 (most extreme positive).
Initially, I intended to predict Tesla Stock Closing price solely using features not relating to the stock price. In order to improve the scores I added several features on top of the NLP scores generated that I believed could help this classification problem.
- Article count : On the days with more articles could indicate an important news day for the stock (i.e earnings, catastrophic event, unexpected event, etc.)
- OBV (On Balance Volume) : a measure of buying and selling pressures as a cumulative indicator that adds volume on up days and subtracts volume on down days. When the security closes lower than the previous close all the day's volume is considered down-volume. Usually when both price and OBV make higher peaks and throughs, the upward trend is more likely to continue and vice versa. For more information please visit https://www.fidelity.com/learning-center/trading-investing/technical-analysis/technical-indicator-guide/obv
- RSI (Relative Strength Index): describe what it is etc.
OBV was too correlated to price and when running it with the tweet sentiments returned results up to 90% accuracy. Since this project was aimed to solve the classification problem without using any direct price metrics I decided to incorporate the NASDAQ (Tesla is apart of this index) movement of the day to help predict in my models. The NASDAQ movement feature is simply a binary column (0= closed down, 1= closed up)

Logistic and RF Classification yielded the best results. It is also apparent that Tesla Stock is more sensitive to Elon Musk's Tweets than NYT Articles from this analysis.
Having a 65% accuracy in predicting stock movement based only on tweet sentiments is a great start, but I would not recommend this model. Additional tuning and evaluation needs to be performed. I would like to overlay reddit posts (WSB) and other outside sources in order to assess the sensitivity. This analysis can also be applied to a number of other volatile stocks.
Finally, I overlaid the stock price of TESLA with Robintrack (https://robintrack.net/), which provides information on Robinhood users and their holdings of certain stocks. Eventually I want to use this information to analyze how retail traders react to negative and positive sentiments regarding a stock.
