This project is part of the Data Exploration and Visualization module.
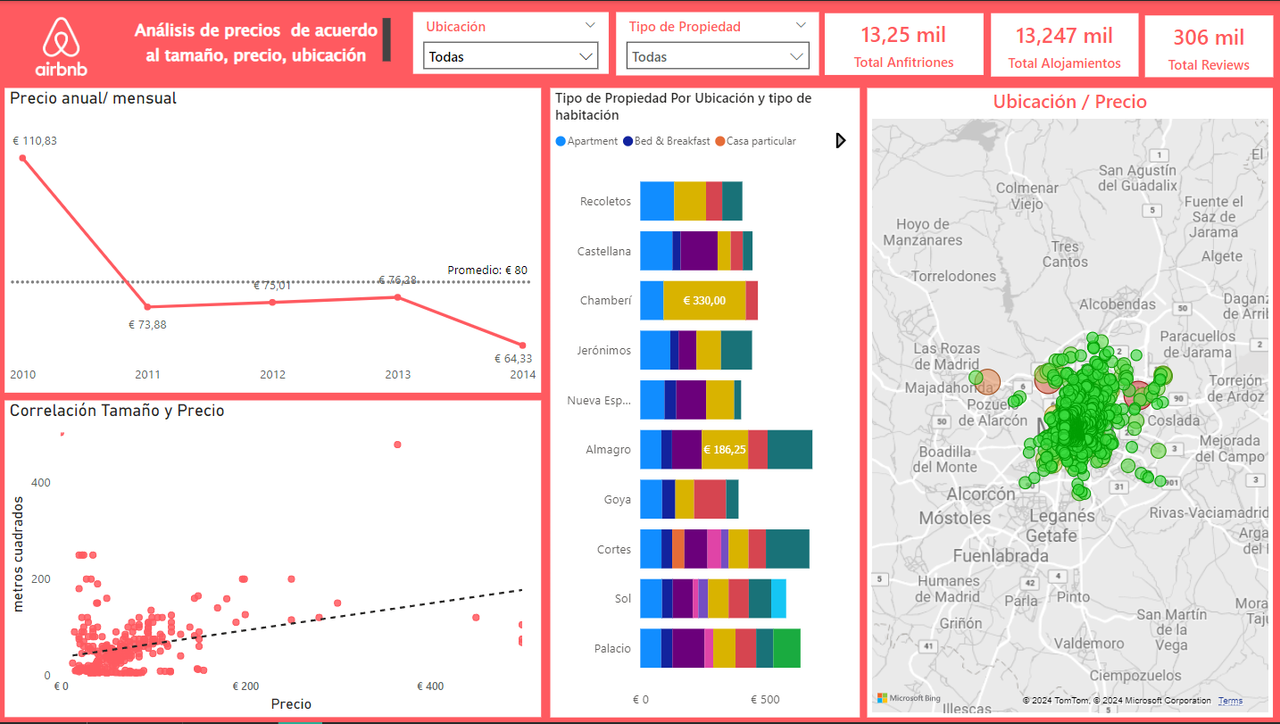
Using the "Airbnb Listings Madrid" dataset, I developed an interactive dashboard that helps visualize Airbnb accommodation prices in Madrid.
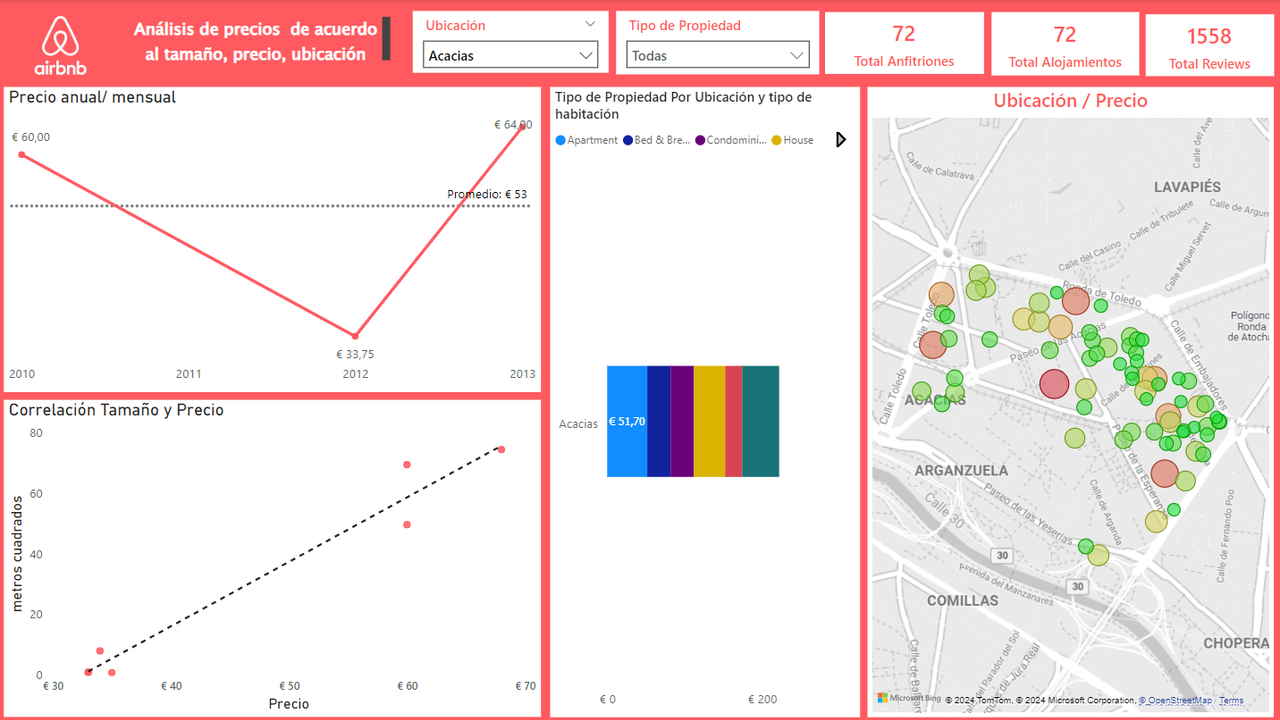
✅ At the top of the dashboard, there are two filters: One to select the location and another to filter by property type.
✅On the right-hand side, information is displayed regarding the number of hosts, accommodations, and reviews associated with each listing.
✅The Annual/Monthly Price chart shows the price changes over the years.
✅The chart at the bottom illustrates whether there is a correlation between the size of the accommodations (in square meters) and their price.
✅The central table, titled Property Type by Location and Room Type, displays the average price of accommodations based on property type for each location.
✅The interactive map visualizes available accommodations, using a color scale from green (lower price) to red (higher price). When hovering over the bubbles, detailed information about the accommodation is displayed, including its identifier, price, number of rooms, and a graph showing how many times it has been rented and the number of reviews it has received.