A lightweight and customizable React Native chart library for creating stunning visualizations. This library supports Bar Charts, Line Charts, and Pie Charts with various customization options.
Install the package using npm:
npm install react-native-svg react-native-ez-charts- Bar Charts: Simple and Multi-Bar Charts
- Line Charts: Simple and Stacked Line Charts
- Pie Charts: Inscribed and Offset Pie Charts
- Customizable animations, gradients, tooltips, and more.
import React from 'react';
import {BarChart} from 'react-native-ez-charts';

const SimpleBarChart = () => (
  <BarChart
    catergoricalAxis={['Jan', 'Feb', 'March', 'April', 'May']}
    numericalAxes={[
      {
        data: [100, 233, 322, 122, 34],
        strokeColor: 'blue',
      },
    ]}
    barWidth={100}
    chartHeight={500}
    barGap={20}
    categoricalAxisHeight={50}
    dashedLineGap={20}
    dashedLineWidth={20}
    categoricalLabelTilt={0}
    variant="gradient"
    endOpacity={0.5}
    animationType="timing"
    duration={500}
  />
);

export default SimpleBarChart;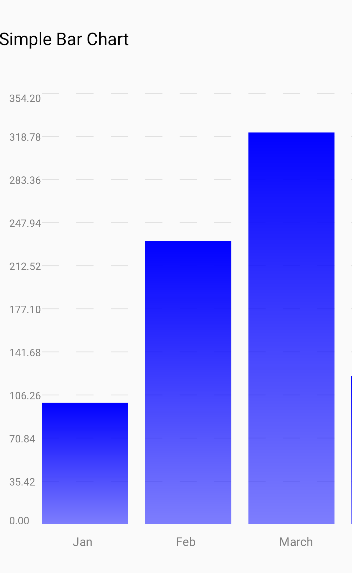
import React from 'react';
import {BarChart} from 'react-native-ez-charts';

const MultiBarChart = () => (
  <BarChart
    catergoricalAxis={['Jan', 'Feb', 'March', 'April']}
    numericalAxes={[
      {
        data: [100, 233, 322, 122],
        strokeColor: 'orange',
      },
      {
        data: [70, 263, 222, 122],
        strokeColor: 'pink',
      },
      {
        data: [170, 223, 212, 212],
        strokeColor: 'grey',
      },
    ]}
    barWidth={100}
    chartHeight={500}
    barGap={20}
    categoricalAxisHeight={50}
    dashedLineGap={20}
    dashedLineWidth={20}
    categoricalLabelTilt={0}
    variant="gradient"
    endOpacity={0.5}
    animationType="timing"
    duration={500}
  />
);

export default MultiBarChart;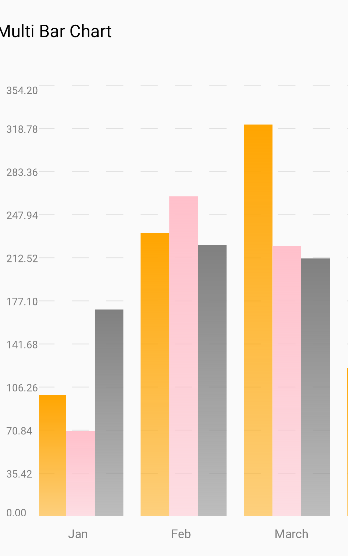
import React from 'react';
import {LineChart} from 'react-native-ez-charts';

const SimpleLineChart = () => (
  <LineChart
    catergoricalAxis={['Jan', 'Feb', 'March', 'April']}
    numericalAxes={[
      {
        data: [100, 133, 122, 122],
        strokeColor: 'red',
        strokeWidth: 2,
      },
    ]}
    xUnit={100}
    chartHeight={300}
    categoricalAxisHeight={50}
    dashedLineGap={20}
    dashedLineWidth={20}
    categoricalLabelTilt={0}
    variant="area"
    showToolTip={true}
    toolTipColor="black"
  />
);

export default SimpleLineChart;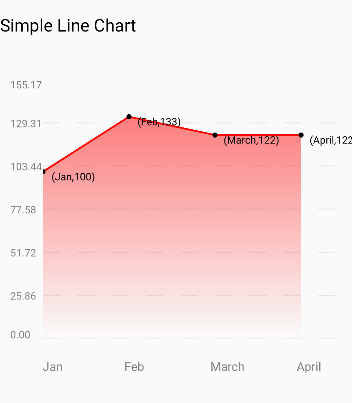
import React from 'react';
import {LineChart} from 'react-native-ez-charts';

const StackedLineChart = () => (
  <LineChart
    catergoricalAxis={['Jan', 'Feb', 'March', 'April', 'May']}
    numericalAxes={[
      {
        data: [100, 133, 122, 122, 121],
        strokeColor: 'pink',
        strokeWidth: 2,
      },
      {
        data: [90, 73, 82, 92, 90],
        strokeColor: 'red',
        strokeWidth: 2,
      },
      {
        data: [20, 43, 42, 42, 69],
        strokeColor: 'grey',
        strokeWidth: 2,
      },
    ]}
    xUnit={100}
    chartHeight={500}
    categoricalAxisHeight={50}
    dashedLineGap={20}
    dashedLineWidth={20}
    categoricalLabelTilt={0}
    variant="area"
    showToolTip={true}
    toolTipColor="black"
  />
);

export default StackedLineChart;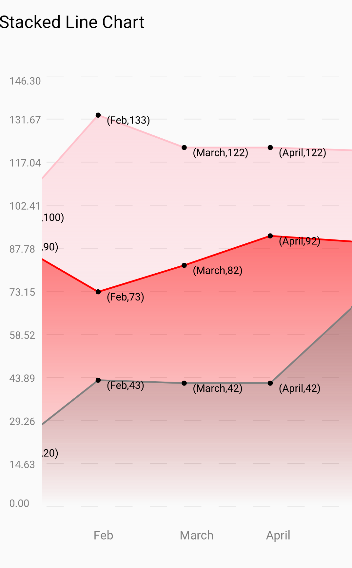
import React from 'react';
import {PieChart} from 'react-native-ez-charts';

const InscribedPieChart = () => (
  <PieChart
    size={180}
    data={[
      {
        value: 30,
        color: '#FF5733',
        label: {value: 'Mango', color: 'black'},
      },
      {
        value: 20,
        color: '#33FF57',
        label: {value: 'Orange', color: 'black'},
      },
      {value: 50, color: '#3357FF', label: {value: 'Peas', color: 'black'}},
      {value: 10, color: 'gray', label: {value: 'Avocado', color: 'black'}},
      {
        value: 20,
        color: '#33FF57',
        label: {value: 'Banana', color: 'black'},
      },
    ]}
    variant="inscribed"
    labelFontSize={15}
  />
);

export default InscribedPieChart;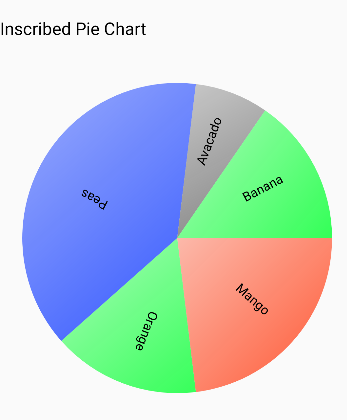
import React from 'react';
import {PieChart} from 'react-native-ez-charts';

const OffsetPieChart = () => (
  <PieChart
    size={250}
    data={[
      {
        value: 30,
        color: '#FF5733',
        label: {value: 'Mango', color: 'black'},
      },
      {
        value: 20,
        color: '#33FF57',
        label: {value: 'Orange', color: 'black'},
      },
      {value: 50, color: '#3357FF', label: {value: 'Peas', color: 'black'}},
      {value: 10, color: 'gray', label: {value: 'Avocado', color: 'black'}},
      {
        value: 20,
        color: '#33FF57',
        label: {value: 'Banana', color: 'black'},
      },
    ]}
    variant="offset"
    labelFontSize={15}
  />
);

export default OffsetPieChart;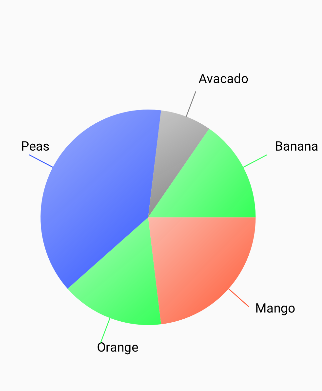
The BarChart component allows you to render a customizable bar chart. Below is a table describing all the available props:
| Prop Name | Type | Required | Default Value | Description |
|---|---|---|---|---|
numericalAxes |
NumericalAxisType[] |
Yes | N/A | An array of objects defining the data and stroke color for each numerical axis. |
catergoricalAxis |
string[] |
Yes | N/A | An array of strings defining the categorical axis labels. |
barWidth |
number |
Yes | N/A | The width of each bar in the chart. |
barGap |
number |
Yes | N/A | The gap between bars in the chart. |
chartHeight |
number |
No | N/A | The height of the chart. |
minChartWidth |
number |
No | N/A | The minimum width of the chart. |
categoricalAxisHeight |
number |
No | N/A | The height of the categorical axis. |
categoricalLabelTilt |
TiltAngle |
No | N/A | The tilt angle of the categorical labels. |
dashedLineWidth |
number |
No | N/A | The width of dashed lines in the chart. |
dashedLineGap |
number |
No | N/A | The gap between dashed lines in the chart. |
dashedLineColor |
string |
No | N/A | The color of dashed lines in the chart. |
categoricalLabelColor |
string |
No | N/A | The color of the categorical labels. |
numericalLabelColor |
string |
No | N/A | The color of the numerical labels. |
categoricalLabelFontSize |
number |
No | N/A | The font size of the categorical labels. |
numericalLabelFontSize |
number |
No | N/A | The font size of the numerical labels. |
variant |
'gradient' | 'default' |
No | 'default' |
The visual variant of the chart. |
animationType |
AnimationType |
No | N/A | The type of animation applied to the chart. |
friction |
number |
No | N/A | The friction value for the animation (if applicable). |
tension |
number |
No | N/A | The tension value for the animation (if applicable). |
duration |
number |
No | N/A | The duration of the animation in milliseconds. |
easing |
(value: number) => number |
No | N/A | A custom easing function for the animation. |
endOpacity |
number |
No | N/A | The ending opacity for the gradient variant of the chart. |
The NumericalAxisType defines the structure of the numericalAxes prop:
export interface NumericalAxisType {
  data: Array<number>;
  strokeColor: string;
}Here is a table summarizing the properties and types for the LineChart and CategoricalAxis components:
| Prop | Type | Description |
|---|---|---|
catergoricalAxis |
Array<string> |
Labels for the categorical axis. |
numericalAxes |
NumericalAxisType[] |
Array of numerical axis configurations, including data and styles. |
chartHeight |
number (optional) |
Height of the chart. |
minChartWidth |
number (optional) |
Minimum width of the chart. |
modifyToolTipLabel |
(x: string, y: number) => string (optional) |
Function to modify the tooltip label. |
xUnit |
number (optional) |
Unit spacing for the x-axis. |
showToolTip |
boolean (optional) |
Whether to show tooltips on the chart. |
categoricalAxisHeight |
number (optional) |
Height of the categorical axis. |
categoricalLabelTilt |
TiltAngle (optional) |
Angle for tilting the categorical labels. |
dashedLineWidth |
number (optional) |
Width of dashed grid lines. |
dashedLineGap |
number (optional) |
Gap between dashed grid lines. |
dashedLineColor |
string (optional) |
Color of dashed grid lines. |
variant |
`'area' | 'blank'` (optional) |
categoricalLabelColor |
string (optional) |
Color of the categorical axis labels. |
numericalLabelColor |
string (optional) |
Color of the numerical axis labels. |
categoricalLabelFontSize |
number (optional) |
Font size for categorical labels. |
numericalLabelFontSize |
number (optional) |
Font size for numerical labels. |
toolTipColor |
string (optional) |
Color of the tooltip. |
| Property | Type | Description |
|---|---|---|
data |
Array<number> |
Data points for the numerical axis. |
strokeColor |
string |
Color of the line representing the data. |
strokeWidth |
number |
Width of the line representing the data. |
| Prop | Type | Description |
|---|---|---|
categoricalAxis |
Array<string> |
Labels for the categorical axis. |
xUnit |
number |
Unit spacing for the categorical axis. |
height |
number (optional) |
Height of the categorical axis. |
tiltAngle |
TiltAngle (optional) |
Angle to tilt the labels for better readability. |
labelColor |
string (optional) |
Color of the categorical labels. |
fontSize |
number (optional) |
Font size of the categorical labels. |
| Value | Description |
|---|---|
0 |
No tilt (horizontal). |
5-90 |
Angle in degrees to tilt labels for readability. |
| Prop | Type | Description |
|---|---|---|
data |
Slice[] |
Array of slices representing the pie chart. Each slice contains value, color, and optionally a label. |
variant |
`"offset" | "inscribed"` (optional) |
size |
number |
Diameter of the pie chart. |
labelFontSize |
number (optional) |
Font size for the labels inside the pie chart. |
gradient |
boolean (optional) |
Whether to apply a gradient effect to the chart. |
endOpacity |
number (optional) |
Opacity at the end of the gradient (if enabled). |
| Property | Type | Description |
|---|---|---|
value |
number |
Value of the slice, determines its size proportion in the chart. |
color |
string |
Color of the slice. |
label |
{ value: string, color: string } (optional) |
Optional label for the slice, with text and color. |
This library is licensed under the MIT License.