The rn-heatmap package provides a customizable activity heatmap similar to GitHub's contribution graph, built with react-native-svg.
npm install rn-heatmapor with Yarn:
yarn add rn-heatmapEnsure you have react-native-svg installed:
npm install react-native-svgimport React from 'react';
import { View } from 'react-native';
import {Heatmap} from 'rn-heatmap';
const LightModeHeatmap = () => {
return (
<View>
<Heatmap
year={2024}
activeDays={[
{monthIndex: 0, dayIndex: 5, level: 2},
{monthIndex: 2, dayIndex: 10, level: 3},
{monthIndex: 5, dayIndex: 20, level: 1},
]}
defaultCellColor="#808080"
colorMap={{
1: '#a3d9a5',
2: '#57c84d',
3: '#228b22',
}}
cellSize={12}
dayGap={6}
monthlyGap={30}
textPadding={10}
fontWeight="bold"
getMonthAnnotation={monthIndex =>
[
'Jan',
'Feb',
'Mar',
'Apr',
'May',
'Jun',
'Jul',
'Aug',
'Sep',
'Oct',
'Nov',
'Dec',
][monthIndex]
}
showMonthAnnotation={true}
monthlyAnnotationFontSize={12}
monthlyAnnotationColor="black"
cellBorderRadius={4}
paddingHorizontal={15}
paddingVertical={5}
bottomPadding={15}
showCurrentFullYear={true}
showScrollBar={true}
/>
</View>
);
};
export default LightModeHeatmap;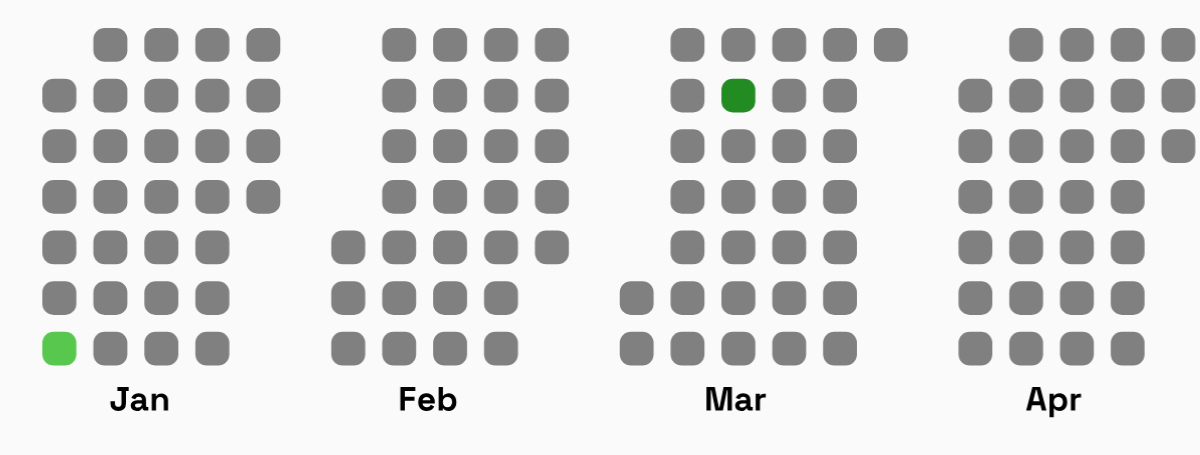
import React from 'react';
import { View } from 'react-native';
import {Heatmap} from 'rn-heatmap';

const DarkModeHeatmap = () => {
  return (
    <View>
      <Heatmap
        year={2024}
        activeDays={[
          {monthIndex: 0, dayIndex: 5, level: 2},
          {monthIndex: 2, dayIndex: 10, level: 3},
          {monthIndex: 5, dayIndex: 20, level: 1},
        ]}
        defaultCellColor="#161b22"
        colorMap={{
          1: '#0e4429',
          2: '#006d32',
          3: '#26a641',
        }}
        cellSize={14}
        dayGap={8}
        monthlyGap={35}
        textPadding={12}
        fontWeight="bold"
        getMonthAnnotation={monthIndex =>
          [
            'Jan',
            'Feb',
            'Mar',
            'Apr',
            'May',
            'Jun',
            'Jul',
            'Aug',
            'Sep',
            'Oct',
            'Nov',
            'Dec',
          ][monthIndex]
        }
        showMonthAnnotation={true}
        monthlyAnnotationFontSize={12}
        monthlyAnnotationColor="white"
        cellBorderRadius={4}
        paddingHorizontal={15}
        paddingVertical={5}
        bottomPadding={15}
        showCurrentFullYear={true}
        showScrollBar={true}
      />
    </View>
  );
};

export default DarkModeHeatmap;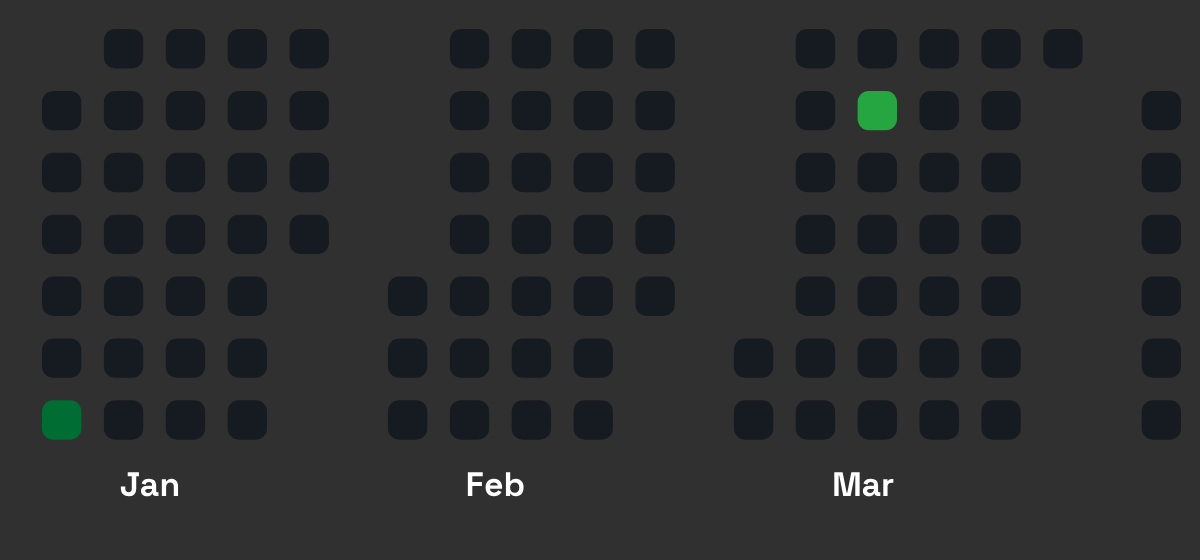
| Prop | Type | Default | Description |
|---|---|---|---|
year |
number |
Required | The year for which the heatmap is generated. |
activeDays |
Array<Activity> |
[] |
List of active days with their month, day index, and activity level. |
defaultCellColor |
string |
#161b22 |
The default background color for inactive days. |
colorMap |
{[key: number]: string} |
{1: '#0e4429', 2: '#006d32', 3: '#26a641'} |
Color mapping for different activity levels. |
cellSize |
number |
12 |
The size of each cell representing a day. |
dayGap |
number |
6 |
The gap between each day's cell. |
monthlyGap |
number |
30 |
The gap between months. |
textPadding |
number |
10 |
Padding for month annotations. |
fontWeight |
FontWeight |
'normal' |
Font weight for month labels. |
getMonthAnnotation |
(monthIndex: number) => string |
getMonthFromMonthIndex |
Function to get month labels. |
showMonthAnnotation |
boolean |
true |
Whether to display month labels. |
monthlyAnnotationFontSize |
number |
10 |
Font size for month labels. |
monthlyAnnotationColor |
string |
'white' |
Color of month labels. |
cellBorderRadius |
number |
2 |
Border radius for day cells. |
paddingHorizontal |
number |
10 |
Horizontal padding for the component. |
paddingVertical |
number |
0 |
Vertical padding for the component. |
bottomPadding |
number |
10 |
Bottom padding for the heatmap. |
showCurrentFullYear |
boolean |
false |
Whether to show the entire current year or only past days. |
showScrollBar |
boolean |
false |
Whether to show the horizontal scrollbar. |
Each Activity object in activeDays should have the following structure:
interface Activity {
  monthIndex: number; // 0-based index (0 = January, 11 = December)
  dayIndex: number;   // 0-based index (0 = first day of the month)
  level: 1 | 2 | 3;   // Activity level, corresponding to `colorMap`
}- Fork the repository.
- Clone the repo:
git clone https://github.com/yourusername/rn-heatmap.git - Install dependencies:
npm install - Run project by :
npm run android or npm run ios etc - Make your changes.
- Submit a pull request.
MIT License