Visual tool to inspect and filter units based on their response to stimulus. After spike-sorting and curation an experimenter ends up with hundreds of units. Many of them if not majority, are silent, or barely respond to the stimulus. Spike sorting stage of the analysis pipeline is agnostic to these characteristis. This tool allows developing rules regarding activity-based filtering. It computes, compares and visualizes firing rate of a small portion of trials in baseline and signal time windows.
- Dense extracellular recordings, e.g. Neuropixels.
- Spikes are sorted and curated
- The experiment consist of trials with stimulus: visual, auditory etc
- Many units are either not active enough or not responding
- Quick computation of trial-based activity (firing rates)
- Quick visualization of raster plots of a unit activity in all experiments separately
- Filtering by activity levels
- Option to filter using only one(the most important) of the experiments, while ignoring the activity levels for the rest
It's best practice to install Python packages in a dedicated environment. Choose one:
Option A: Using conda (recommended if you have it installed)
conda create -n active-units python=3.10
conda activate active-units
Option B: Using venv (Python's built-in tool)
python3 -m venv au-env
source au-env/bin/activate
On Windows, use: au-env\Scripts\activate
pip install active-unitsgit clone https://github.com/vitalylerner/active-units.git
cd active-units
pip install -e .This installs the package and makes the active-units command available in your terminal.
For the first start, example data are used, so the tool will start even if you do not have your own data yet.
Start the GUI launcher in one of two ways:
Option 1: After installing the package (requires pip install -e .)
active-units-guiOption 2: Without installation (run directly from cloned repo)
python -m active_units.gui_launcher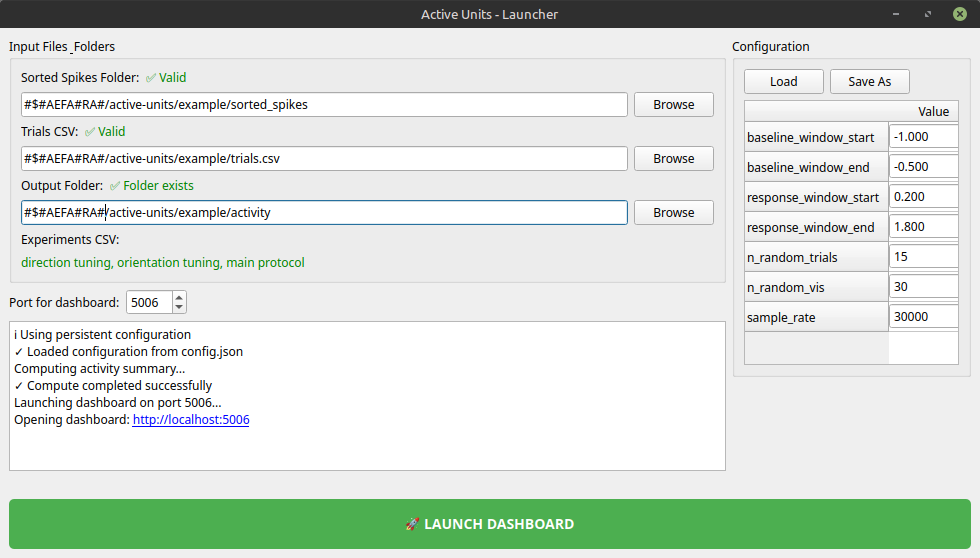
The launcher walks you through:
- Selecting your spike sorting output folder
- Choosing your trials CSV file
- Configuring activity filter parameters
- Computing unit activity statistics
- Opening the interactive dashboard to filter and export units
Standard output from any spike sorter (kilosort4, kilosort3 etc):
sorted_spikes/
├── spike_times.npy          # 1D array: spike times in samples
├── spike_clusters.npy       # 1D array: cluster ID per spike
└── cluster_group.tsv        # Optional: cluster quality labels (good/mua/noise)
The tool needs to have some information regarding your stimuli.
If all trials were done within a scope of one experiment, you can ommit the experiment column.
If you have, for example 3 experiments (recordings in terms of OpenEphys), then fill the whole table.
This information should be extracted from your stimulus-generation software and the logs it generates.
Simple table with three columns: experiment, trial, sample
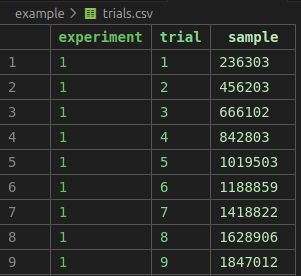
| Column | Type | Meaning |
|---|---|---|
experiment |
int | Experiment/recording ID |
trial |
int | Trial number within experiment/recording |
sample |
int | Spike time anchor (samples, same units as spike_times.npy) |
Activity filter parameters (baseline/response windows, sample rate):
{
  "baseline_window_start": -1.0,
  "baseline_window_end": -0.5,
  "response_window_start": 0.2,
  "response_window_end": 1.8,
  "n_random_trials": 15,
  "n_random_vis": 30,
  "sample_rate": 30000
}| Key | Meaning |
|---|---|
baseline_window_start, baseline_window_end |
Baseline window relative to trial (seconds before sample) |
response_window_start, response_window_end |
Response window relative to trial (seconds after sample) |
n_random_trials |
Number of random trials to sample per experiment |
n_random_vis |
Number of trials shown in raster visualization |
sample_rate |
AP probe sample rate (Hz) |
You can add aliases/protocol names to your experiments in a simple table, experiments.csv in the same directory as trials.csv to add friendly names:
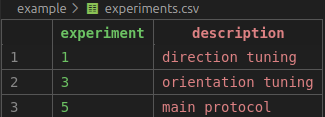
This displays descriptive labels in the dashboard (e.g., "Exp1 (direction tuning)" instead of "Exp1"). You can skip this as well.
When launching the dashboard, a simple analysis of activity is run. Not all trials are taken, but the amount of trials/experiment for quick analysis is limited by the parameter n_random_trials in the confic file. default is 15.
CSV table with baseline and response statistics for each unit in each experiment:
| Column | Meaning |
|---|---|
experiment |
Experiment ID |
unit |
Unit/cluster ID |
bsl_mean |
Mean baseline firing rate (spikes/sec) |
bsl_std |
Std dev of baseline firing rate |
signal_mean |
Mean response firing rate (spikes/sec) |
signal_std |
Std dev of response firing rate |
difference |
signal_mean - bsl_mean |
p_value |
Paired t-test p-value (baseline vs response) |
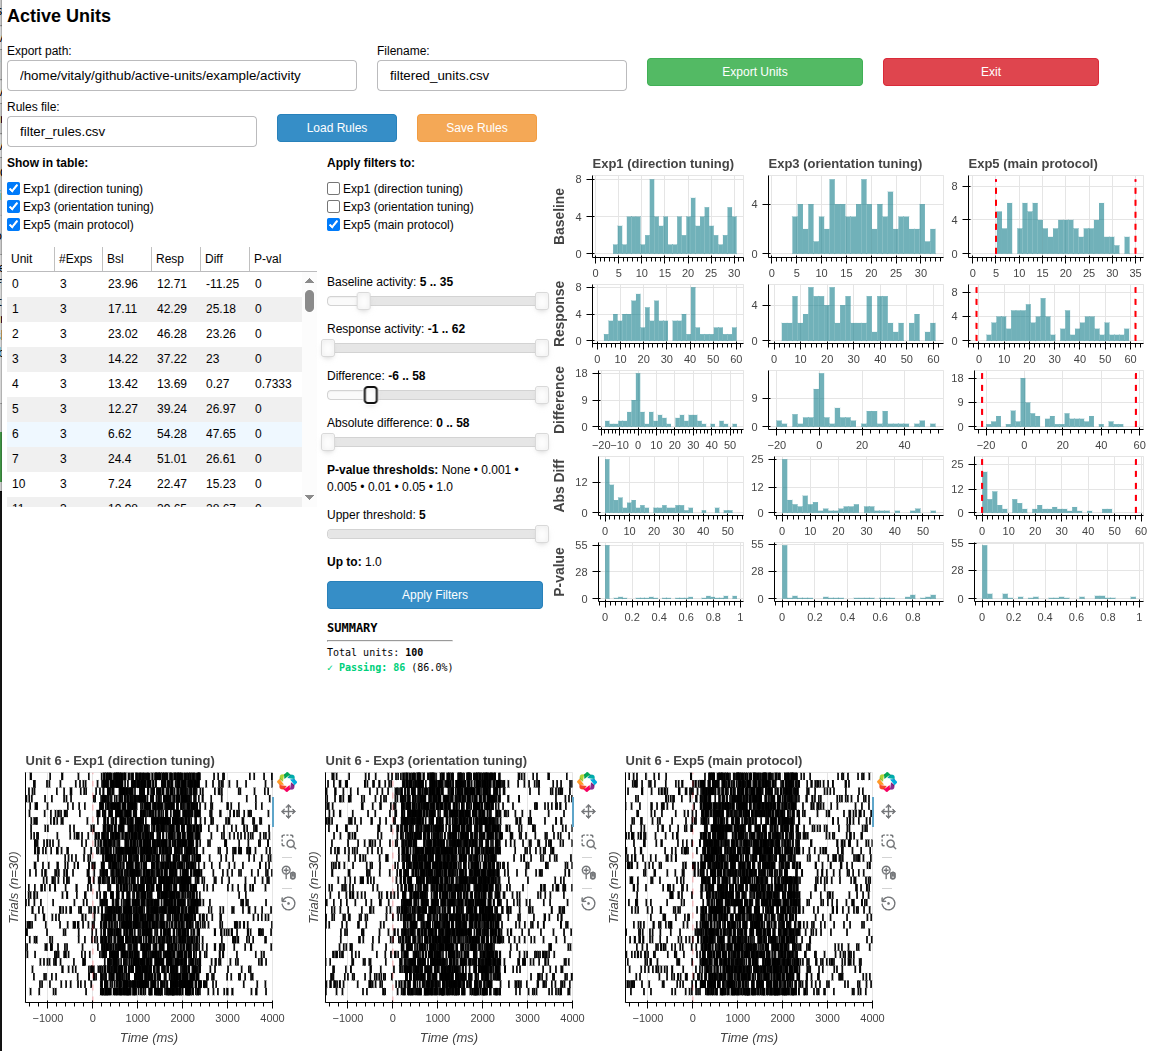
The dashboard lets you filter units visually:
Features:
- Filter by experiment
- Adjust thresholds: baseline activity, response activity, firing rate difference, p-value
- View histograms showing distribution of metrics
- See live-updating summary table of passing units
- Export filtered unit list to CSV
- pandas >= 2.0.0
- numpy >= 1.24.0
- scipy >= 1.10.0
- bokeh >= 3.0.0
- click >= 8.0.0
Pre-generated example data is included in the package. You do not need to generate it.
The example/ folder contains:
- sorted_spikes/ — 100 synthetic units, 2.79M spikes over 30 minutes
- trials.csv — 180 trials across 3 experiments (with realistic trial skipping)
- config.json — default activity filter configuration
- activity/ — pre-computed results ready to visualize
Properties:
- 100 units with baseline firing rates 1-30 sp/s
- Continuous recording (experiments are sequential, not independent)
- Realistic trial structure with skipped/broken fixation trials
- 30 good clusters, 70 mua clusters
Note: The generate_example_data.py script is available if you need to create different synthetic data for testing, but it is not needed for normal use.
[Your license here]
[Contribution guidelines]