
rgeoboundaries is an R client for the geoBoundaries
API, providing country political
administrative boundaries.
You can install the development version of rgeoboundaries using the
remotes package:
# install.packages("remotes")
remotes::install_github("wmgeolab/rgeoboundaries")This is a basic example which shows you how get Mali and Senegal boundaries and plot it
library(rgeoboundaries)
library(sf)
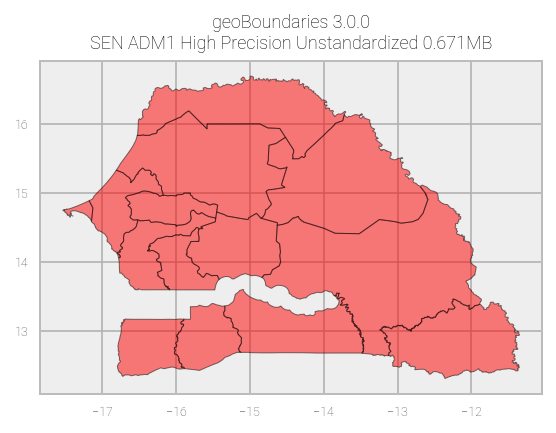
mli_sen <- gb_adm0(c("mali", "senegal"), type = "sscgs")
plot(st_geometry(mli_sen))
We can also get the first administrative division of all countries in the world and use ISO3 code too
egy <- gb_adm1("EGY")
plot(st_geometry(egy),
     col = rgb(red = 1, green = 0, blue = 0, alpha = 0.5),
     axes = TRUE, graticule = TRUE)
In order to access the global administrative zones, you just need to
skip the country argument (i.e set it to NULL) or specify type = "CGAZ".
world <- gb_adm1()
world_lambert <- st_transform(world, "+proj=laea +x_0=0 +y_0=0 +lon_0=0 +lat_0=0")
par(bty = "n")
plot(st_geometry(world_lambert),
     col = "#E39d57",
     graticule = TRUE, lwd = 0.3)
Finally, metadata for each country and administrative level are also available.
knitr::kable(gb_metadata(c("mali", "senegal"), "adm1"))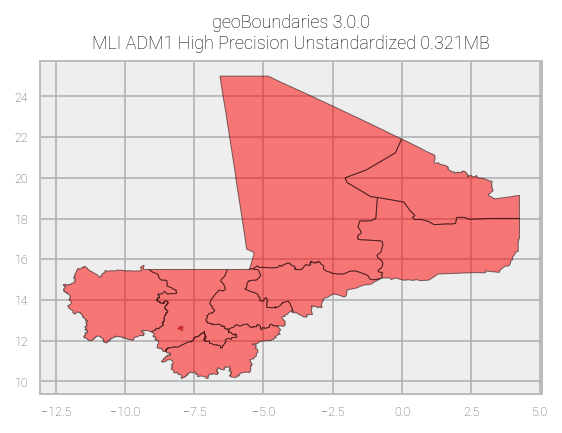
If you are using this package in your analysis, please cite the original
geoBoundaries work:
Runfola D, Anderson A, Baier H, Crittenden M, Dowker E, Fuhrig S, et al. (2020) geoBoundaries: A global database of political administrative boundaries. PLoS ONE 15(4): e0231866. https://doi.org/10.1371/journal.pone.0231866