The Simulator
The project addresses the practical issues regarding the with the policy design of Dynamic Time-of-Use (dToU). This method incentivizes the users to increase or decrease their energy consumption with financial rewards through variable tariffs. It is also known as demand response (DR). The main reason to implement DR is to actively stabilize the system with user participation. On the other hand, users can maximize their energy cost savings by utilizing the incentives provided by the energy retailer.
For the research purpose, the Low Carbon London project was conducted in the United Kingdom (UK) from the beginning of 2011 to the end of 2014. The project was funded by energy consumers via Ofgem's Low Carbon Network Fund. The programme was UK's first dynamic-electricity-pricing trial for the residential sector. The trial was designed to study the impact of large scale dynamic load shifting on the system. In this trial, 5,567 households participated. Out of those, 1,122 households received the experimental dToU tariff that was in effect for the duration of 2013.
The energy consumption data collected in the LCL project ranged for four years. The dToU experiments were only carried out for one year with around 20% of the total participants. This imposes the limitations on the quality of information that the dataset can provide. The reasons are listed below:
- User adaption/learning curve
- Seasonality, Trends of time series
- The 'enthusiast effect' in the trial
The LCL project was first of its kind that was ran with UK residential energy consumers. The trials consisted of motivating people to change their energy consumption pattern, which essentially means that people had to change their life long habit of using their appliances in a certain manner. Therefore, it was natural to expect some resistance by the participating customers while adapting to the new major change in their lifestyle, introduced by the dynamic tariffs. As the original findings of LCL learning report say, "the performance is consistent with a slight reduction in demand response magnitude over the course of the trial" [1]. Additionally, to support this hypothesis, here is the LCL data from January 2013 and October 2013. The data represented in the grey line is the aggregate consumption data of normal tariff users (participating users with single tariff). The blue line represents the aggregate energy consumption of users who participated in dToU tariff scheme.
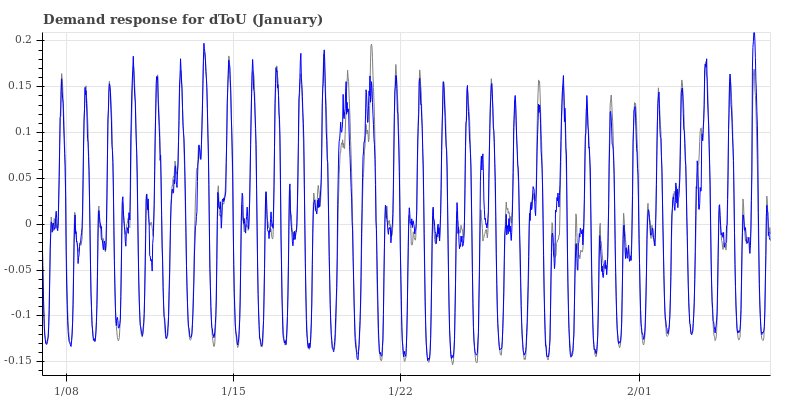
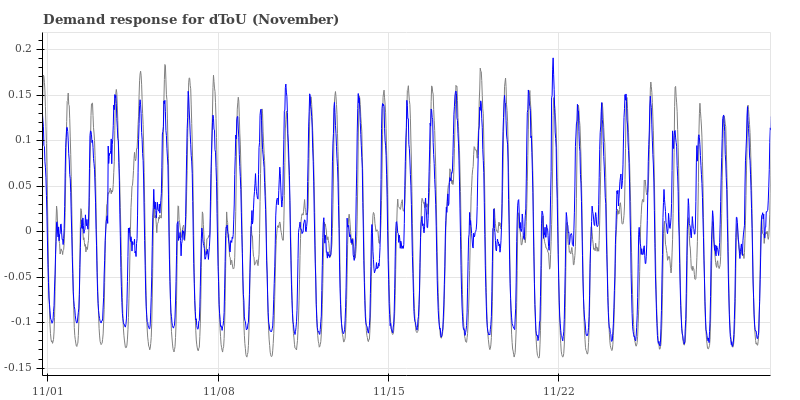
During the initial days of the trial, we can see a very small change in aggregate energy consumption. But over time, the participants of the trial started to positively change the energy usage pattern based on the dToU tariffs. The months of October and November experienced the greatest peak load shifting pattern during the trials. This leads to the next issue about working with LCL data for time series prediction purpose, that is seasonality of time series data.
Seasonality and trends are important characteristics of time series data. Seasonality can be defined as the linear or non-linear component that changes over time and repeats periodically. For energy usage time series data, the most visible seasonal factors are weekly seasonality and annual seasonal change (winter, spring etc.). The following plot shows the data of aggregate energy consumption of normal tariff users in LCL project collected from 2012 to 2014.

The annual periodic changing pattern in energy consumption can be observed clearly. Usually, during summers the overall energy consumption drops due to the rise in ambient temperature. Whereas, during winters overall energy consumption increases due to falling in ambient temperature. These are the findings limited to the UK based on data and overall weather conditions. This user behaviour can be different for different regions/ countries based on local conditions. For this particular dataset, the dToU trials were conducted for the duration of one year. It will be a risky assumption to consider this data to be information-rich about user behaviour characteristics. In other words, even if the data captured the annual seasonality of energy usage pattern, there is no way to cross-validate that claim.
Similarly, the trial period is insufficient to understand any trends in the data. In time series, the trends are linear or non-linear components which do not repeat. In energy consumption data, trends can be listed as an overall increase in energy consumption over the years due to digitalisation, the rise of electric vehicles and increased electric heating systems. Another example of a non-linear trend is irregular load demand due to increasing rooftop solar installations.
This controversial factor might have resulted in a bias in the final results of the trial. The participants of the LCL trials were willingly participating in the project. The active desire for participation might have resulted in biased outcomes in the trials. Therefore, using a machine learning model to learn user behaviour based on the dynamic tariff behaviour of users might not reflect actual response when implemented on a wide scale.
Based on the above concerns, it would be negligent on our side to base the experiment setup on the limited data of one year of user behaviour data. These aforementioned concerns call for the need for a simulator which can simulate historic conditions (based on available LCL dataset) and address the problem of the small LCL dataset by generating new data points. Also, the issue of calculating the load shifting can be solved by manually shaving the demand with some predetermined factor. Although this would not be an ideal solution to model user behaviour, it would be the first approach because of its simplicity.
This section gives an overview of the proposed simulator (version-1). The simulator is based on the statistical knowledge gained by the LCL trials. This knowledge would be implemented for the generation of new data points by introducing the noise in the current dataset. Suppose X denotes the aggregate user behaviour sequence for the normal tariff, Y denotes the aggregate user behaviour sequence for a dToU tariff. θ is the set of parameters which represent the occupancy behaviour. α is the set of user action profile for a given tariff policy.
X = f(θ),
Y = h(X,α)
This architecture allows checking various conditions like alteration in the participating consumers, different climate conditions, various calendar effects (holidays, special events). The architecture is flexible and can be easily modified to study the future demand response by incorporating the increased penetration of home automation and electric vehicles.
The LCL trials found that around 'x'(replace with actual %) per cent of participating users had never reacted to dToU tariffs. From remaining user base, approximately % of users reacted to each trial experiment.
input four seasons
input one of 7 weekdays & also special days
Input original tariff policy. During the experiments, some users started DR early while others started late. These user occupancy characteristics are considered while designing the simulator.