The Simulator
The project addresses the practical issues regarding the with the policy design of Dynamic Time-of-Use (dToU). This method incentivizes the users to increase or decrease their energy consumption with financial rewards through variable tariffs. It is also known as demand response (DR). The main reason to implement DR is to actively stabilize the system with user participation. On the other hand, users can maximize their energy cost savings by utilizing the incentives provided by the energy retailer.
For the research purpose, the Low Carbon London project was conducted in the United Kingdom (UK) from the beginning of 2011 to the end of 2014. The project was funded by energy consumers via Ofgem's Low Carbon Network Fund. The programme was UK's first dynamic-electricity-pricing trial for the residential sector. The trial was designed to study the impact of large scale dynamic load shifting on the system. In this trial, 5,567 households participated. Out of those, 1,122 households received the experimental dToU tariff that was in effect for the duration of 2013.
The energy consumption data collected in the LCL project ranged for four years. The dToU experiments were only carried out for one year with around 20% of the total participants. This imposes the limitations on the quality of information that the dataset can provide. The reasons are listed below:
- User adaption learning cureve
- Seasonality of time series
- The 'enthusiast effect' in the experiments
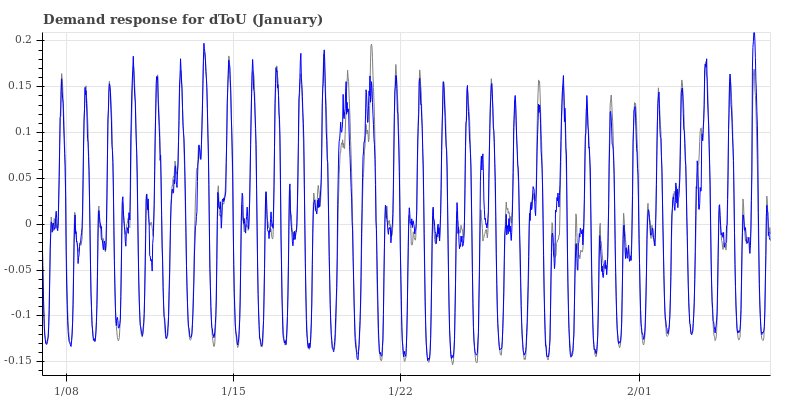
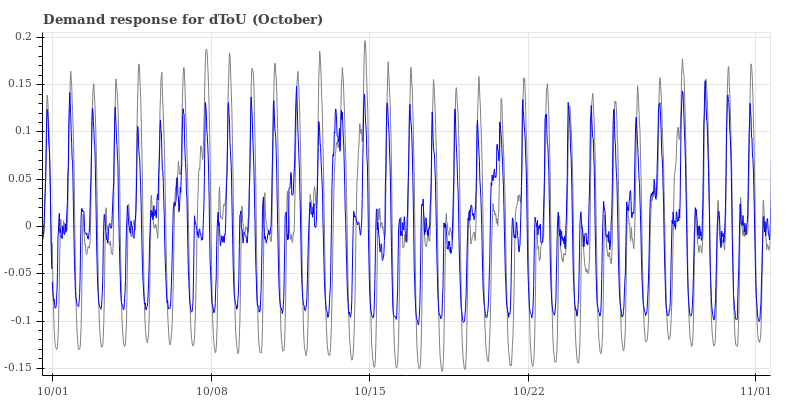
The LCL project was first of its kind that was ran with UK residential energy consumers. The trials consisted of motivating people to change their energy consumption pattern, which essentially means that people had to change their life long habit of using their appliances in certain manner. Therefore, it was natural to expect some resistance by the participating customers while adapting to the new major change in their lifestyle, introduced by the dynamic tariffs. To support this hypothesis, here is the LCL data from January 2013 and October 2013. The data represented in gray line is the aggregate consumption data of normal tariff users (participating users with single tariff). The blue line represents the aggregate energy consumption of users who participated in dToU tariff scheme.