05. Results Genome Assembly
The genome was assembled using Canu. The quality of the assembly was assessed using Quast and Mummer. Four contigs where assembled and the consensus NG75 value is 2563357 meaning that the longest contig is 2563357 bp long and covers at least 75% of the specified reference length (2.6 mbp). The NA75 and the longest alignment value are a bit misleading since the genome is circular and the linearization does not mach up between the reference and the assembly. As can be seen in figure 2 contig 'tig00004064' is aligned to almost the full reference genome and the identity between the two is very high. Two of the contigs could not be aligned at all ('tig00000059' and 'tig00000061') and will be discarded. 'tig00004063' overlaps with 'tig00004064' and will also be discarded. Contig 'tig00004064' will be used as the genome in future analyzes. There is some overlap between the ends of assembly otherwise the assembly is good.
Table 1. Basic statistics of the assembled contigs.
| Contig | Length | %GC | Circular |
|---|---|---|---|
| tig00000059 | 48946 | 48.15 | No |
| tig00000061 | 2597 | 32.23 | No |
| tig00004063 | 21143 | 52.56 | No |
| tig00004064 | 2563357 | 54.21 | Yes |
Table 2. Basic quality statistics from Quast.
| Statistic | Value |
|---|---|
| Largest alignment | 1463673 |
| Total aligned length | 2584500 |
| NG75 | 2563357 |
| NA75 | 1099684 |
| LG75 | 1 |
| fully unaligned contigs | 2 |
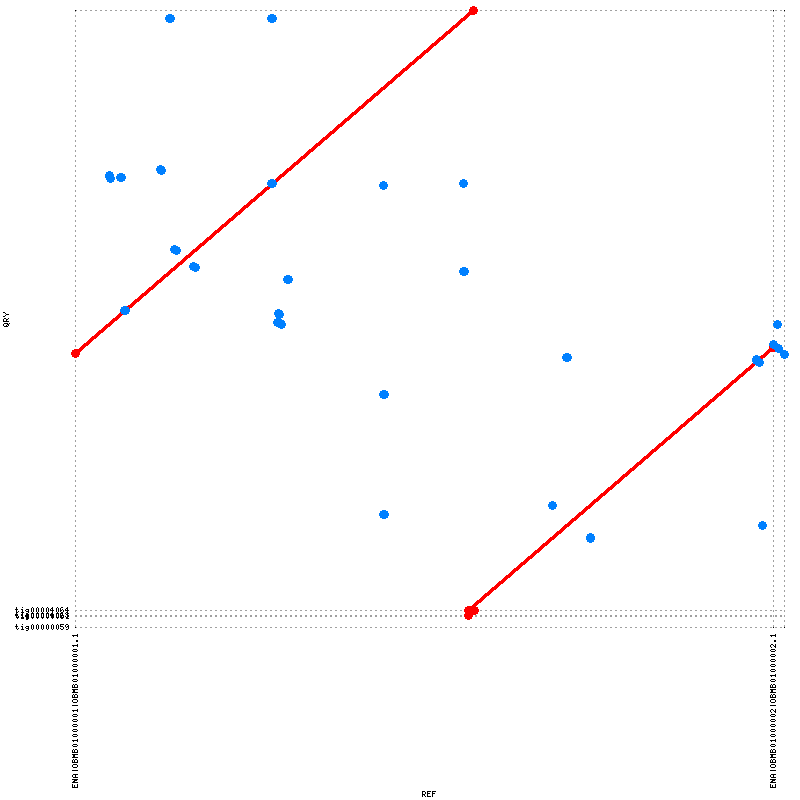
Figure 1. The contigs aligned using Nucmer and visualized using Mummerplot.The assembled contig 'tig00004064' is aligned to approximately all of the reference with high identity (~99.99% identity).
To fix the overlap at the edges I tried to run circlator. I also tried to polish the assembly using the raw reads with arrow. Both of these analysis are very time consuming and haven't managed to be completed on the cluster. I have decided to move on for now and in case I have time at the end of the project I will look into refining the assembly again. Since my assembly is of good quality as it is I will proceed with it the way it is for now.
What information can you get from the plots and reports given by the assembler (if you get any)? What intermediate steps generate informative output about the assembly?
Canu provides a report file which contains information about all the steps of the assembly. In the report file you get a histogram of the read lengths and the k-mers. You also get information about overlaps, the corrected data and the basic statistics about the assembled contigs such as length and N50.
How many contigs do you expect? How many do you obtain?
In the article they obtained two high quality contigs, one being the bacterial chromosome and the other probably being a phage. Based on this I expected to see at least two contigs, probably more. I obtained four contigs. Contig "tig00004064" corresponds to the bacterial chromosome and contig "tig00000059" could correspond to the phage (similar in length to what was observed in the article but I have not investigated this).
What is the difference between a ‘contig’ and a ‘unitig’?
A contig are a set of overlapping DNA sequences that together form an assembled region of a genome. A untig is a special type of contig with stricter constraints. A untig is a set of DNA sequences for which there is no alternative overlap pattern. A contig is formed by untigs.
What is the difference between a ‘contig’ and a ‘scaffold’?
A scaffold is a number of assembled contigs separated by gaps but with know placement due to paired end reads mapped to each of the contigs.
What are the k-mers? What k-mer(s) should you use? What are the problems and benefits of choosing a small k-mer? And a big k-mer?
Many softwares use de Bruijn graphs to assemble reads into genomes. This is a graph with sub-strings of length k found in the reads representing the edges and sub-strings of length k-1 representing the nodes. By reducing the graph in different ways contigs can be obtained. The parameter k is often the most important with this kind of assembly algorithm and choosing the right k is a trade off between different effects. If the k is to small longer repeats might break up the contigs but if k is to large the probability of the k-mer containing a mistake is increased.
Some assemblers can include a read-correction step before doing the assembly. What is this step doing?
Especially long read technologies result in high error rates and benefit from a correction step before assembling the reads. This can be done in different ways. The same biological sample can be sequenced using both long and short read technologies. The long reads are then corrected using the short reads which have much lower error rates before assembly. This is called a hybrid method and can greatly improve the error rates of the long reads. Another way to do it is to correct based on the long reads them self. Different software do this is different ways but the basic concept is to do pairwise alignments and calculate some kind of consensus based on this.
Can you see any other letter appart from AGTC in your assembly? If so, what are those?
I can't find any other letters than AGCT in my assembly but fasta files can also contain N which indicates that that position could be any of A, T, C or G.
What do measures like N50, N90, etc. mean? How can they help you evaluate the quality of your assembly? Which measure is the best to summarize the quality of the assembly (N50, number of ORFs, completeness, total size, longest contig...)
The N50, N90 etc. is a statistic calculated by first ordering the contigs from longest to shortest. The N50 value is then the length of the shortest contig amongst the contigs that cover the first 50% of the total assembly (chromosome). The N90 is calculated in the same way but using 90% instead of 50%. The Nx statistics help evaluate the continuity of your assembly. A low N50 value means that your assembly consists of have many short contigs but doesn't really say anything about the quality. The quality is best assessed with a holistic view of different measures such as N50, number of ORFs, completeness, total size, longest contig etc.
How does your assembly compare with the reference assembly? What can have caused the differences?
My assembly compares very well to the reference genome from the article. It is of the same length and aligns fully to the reference as can be seen in figure 1.
Why do you think your assembly is better/worse than the public one?
My assembly is probably a bit worse than the reference since I was not able to complete some of the polishing steps that I attempted. I wanted to circularize it to get rid of the overlapping ends and to polish it using arrow to get better quality. Both these steps where very slow.