How to Use OpenTelemetry to Monitor Kafka
In previous articles, we introduced how AutoMQ integrates with Prometheus, Observability Cloud, and Nightingale Monitoring as backend systems to monitor AutoMQ. This article will further describe the observability architecture of AutoMQ and how AutoMQ achieves multi-cloud observability.
Apache Kafka's server-side primarily relies on YammerMetrics, a third-party library, to define and collect metrics. It exposes observation interfaces by registering metrics to the MBeans server, and during the actual integration process, third-party agents such as jmx_exporter are required to complete the integration with the observability backend. As a cloud-native reimagined stream processing platform, AutoMQ naturally requires more native observability methods. OpenTelemetry (OTel for short), as the de facto standard framework for cloud-native application observability, naturally becomes the first choice for AutoMQ. The overall observability architecture of AutoMQ is illustrated below. This section will introduce the architecture in four parts: collection, export, observability backend, and visualization frontend.
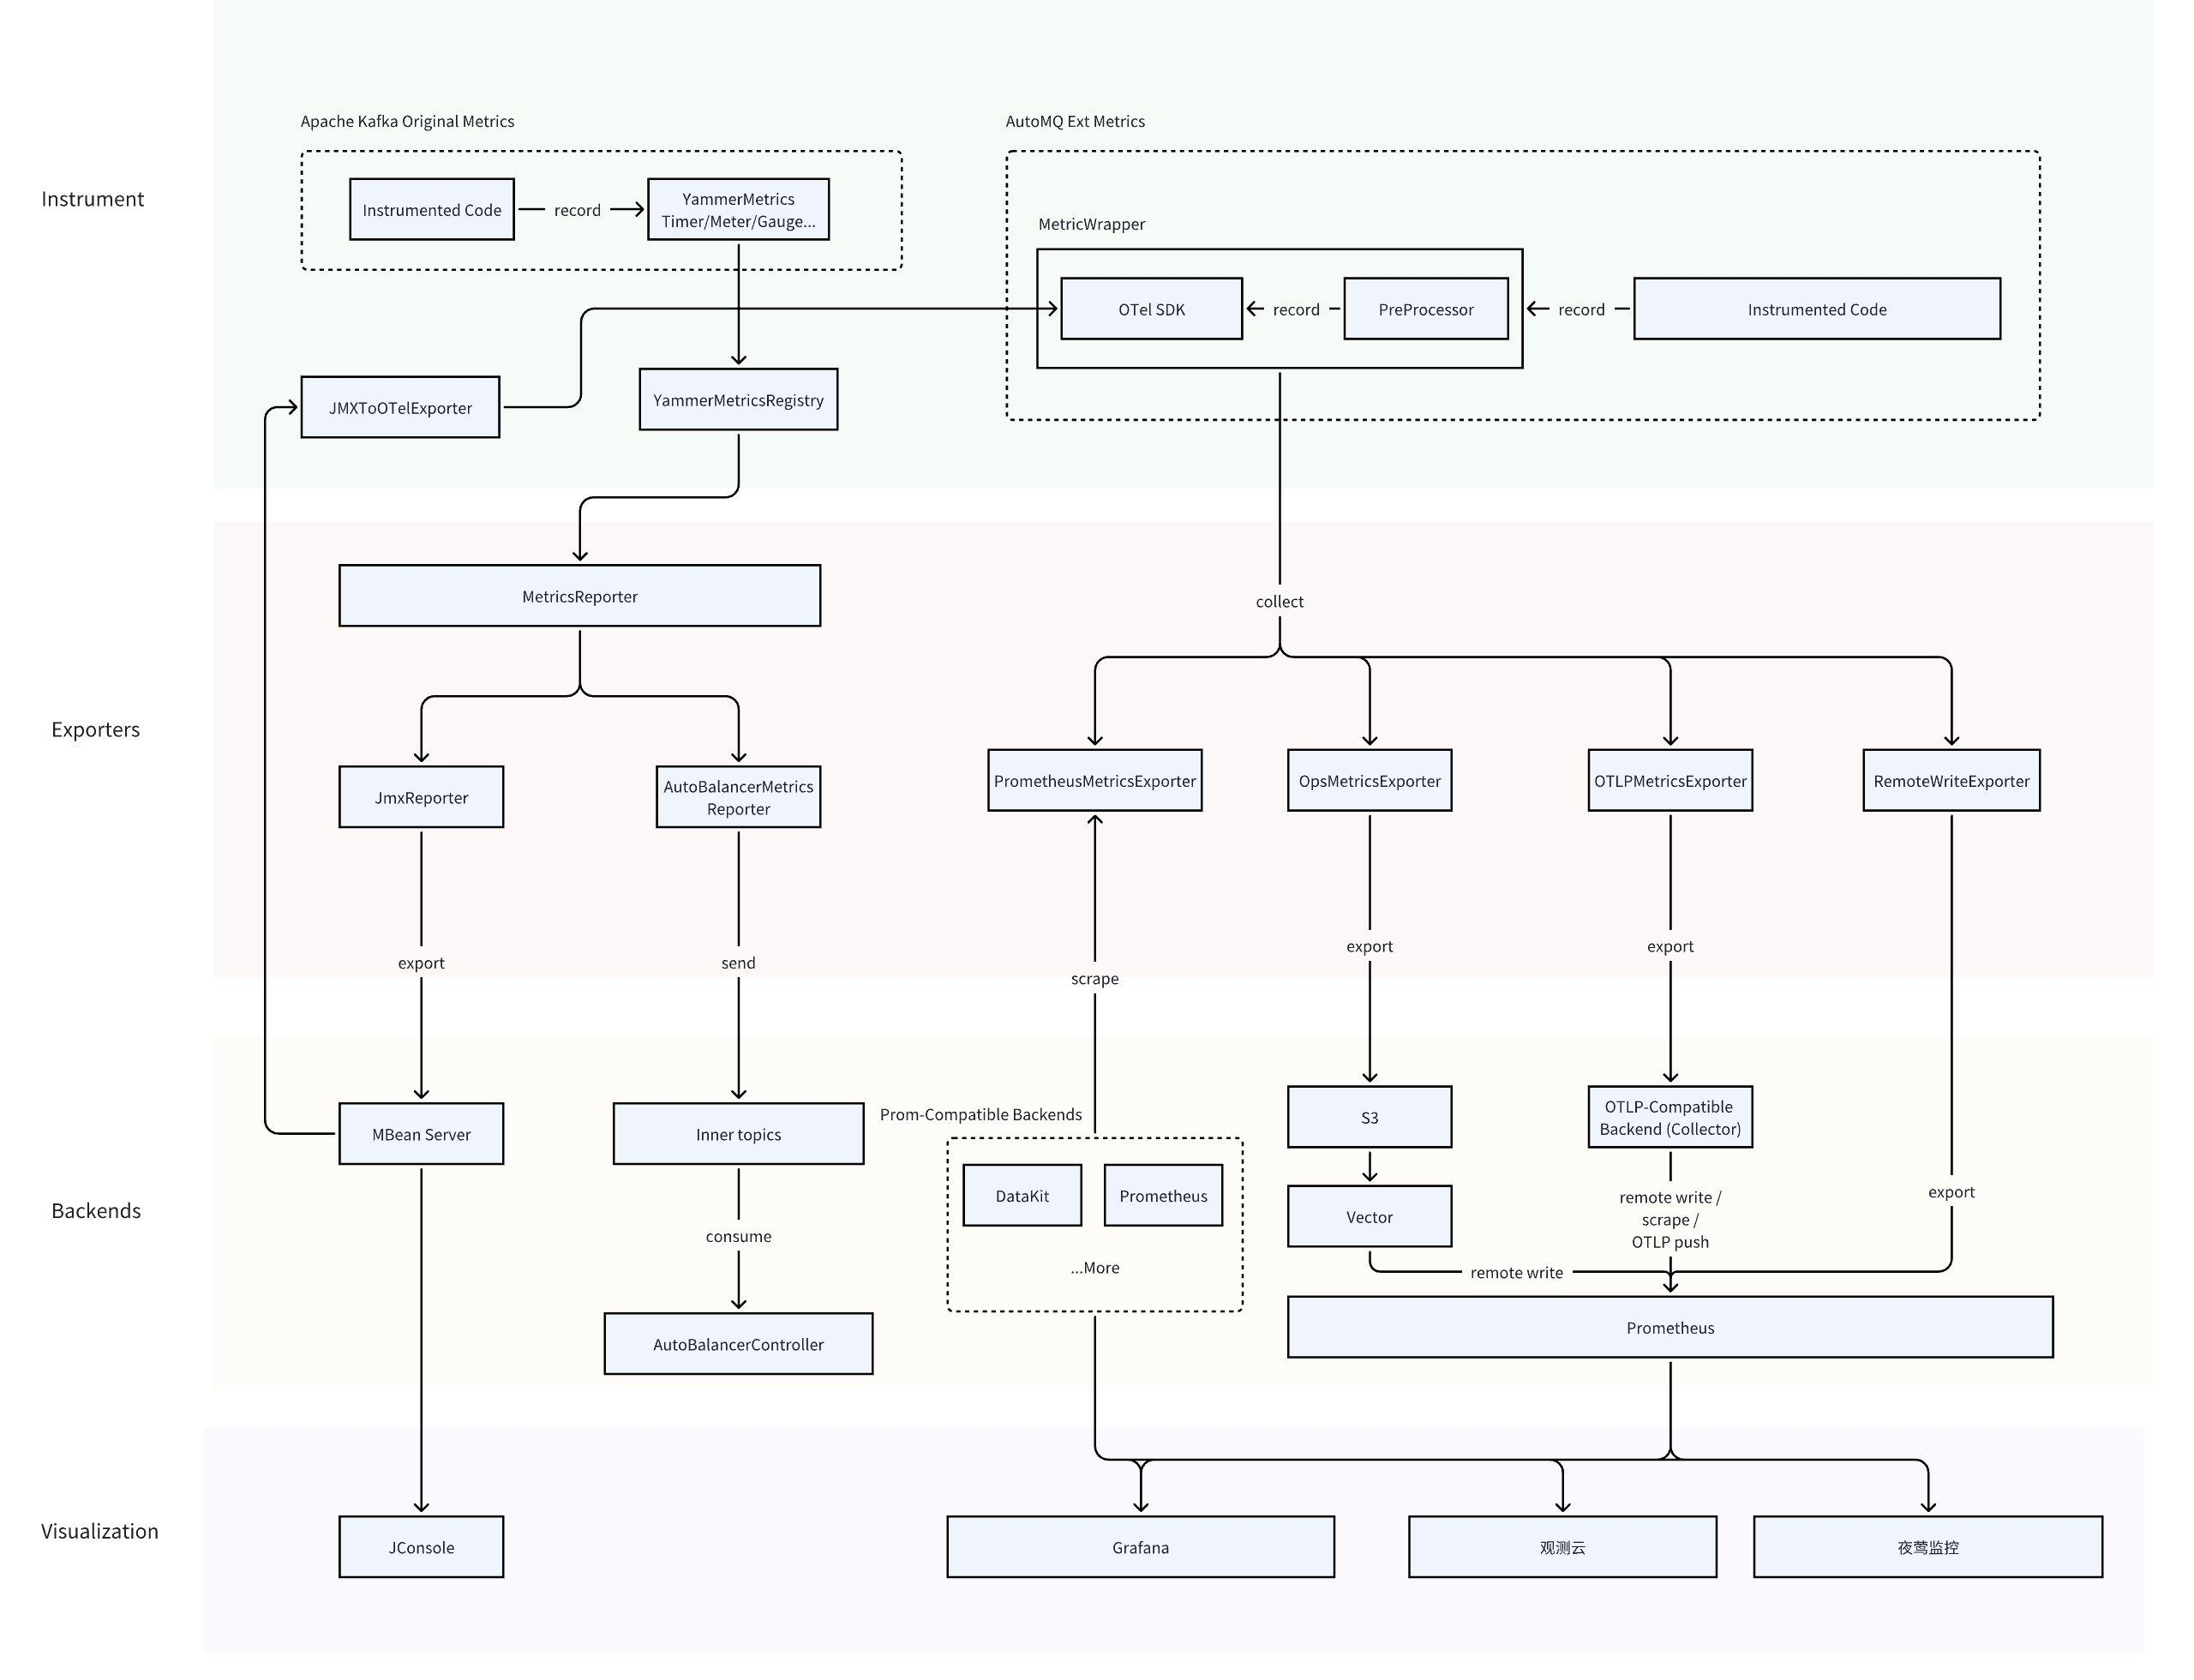
On the collection side, AutoMQ retains the native metric collection pipeline of Apache Kafka and utilizes the OTel community’s JMXMetrics library to convert metrics from JMX to OTLP format. For metrics newly added by AutoMQ itself, all are collected using the OTel SDK.
Based on Apache Kafka MetricsReporter interface:
-
JmxReporter: As mentioned earlier, this is the native metrics export method for Apache Kafka, which exports metrics in JMX format through the YammerMetrics Library.
-
AutoBalancerMetricsReporter: An internal metrics collector implemented by AutoMQ, primarily used for collecting load-related metrics at the node and partition levels and writing them into an internal Topic.
Based on OTLP SDK:
-
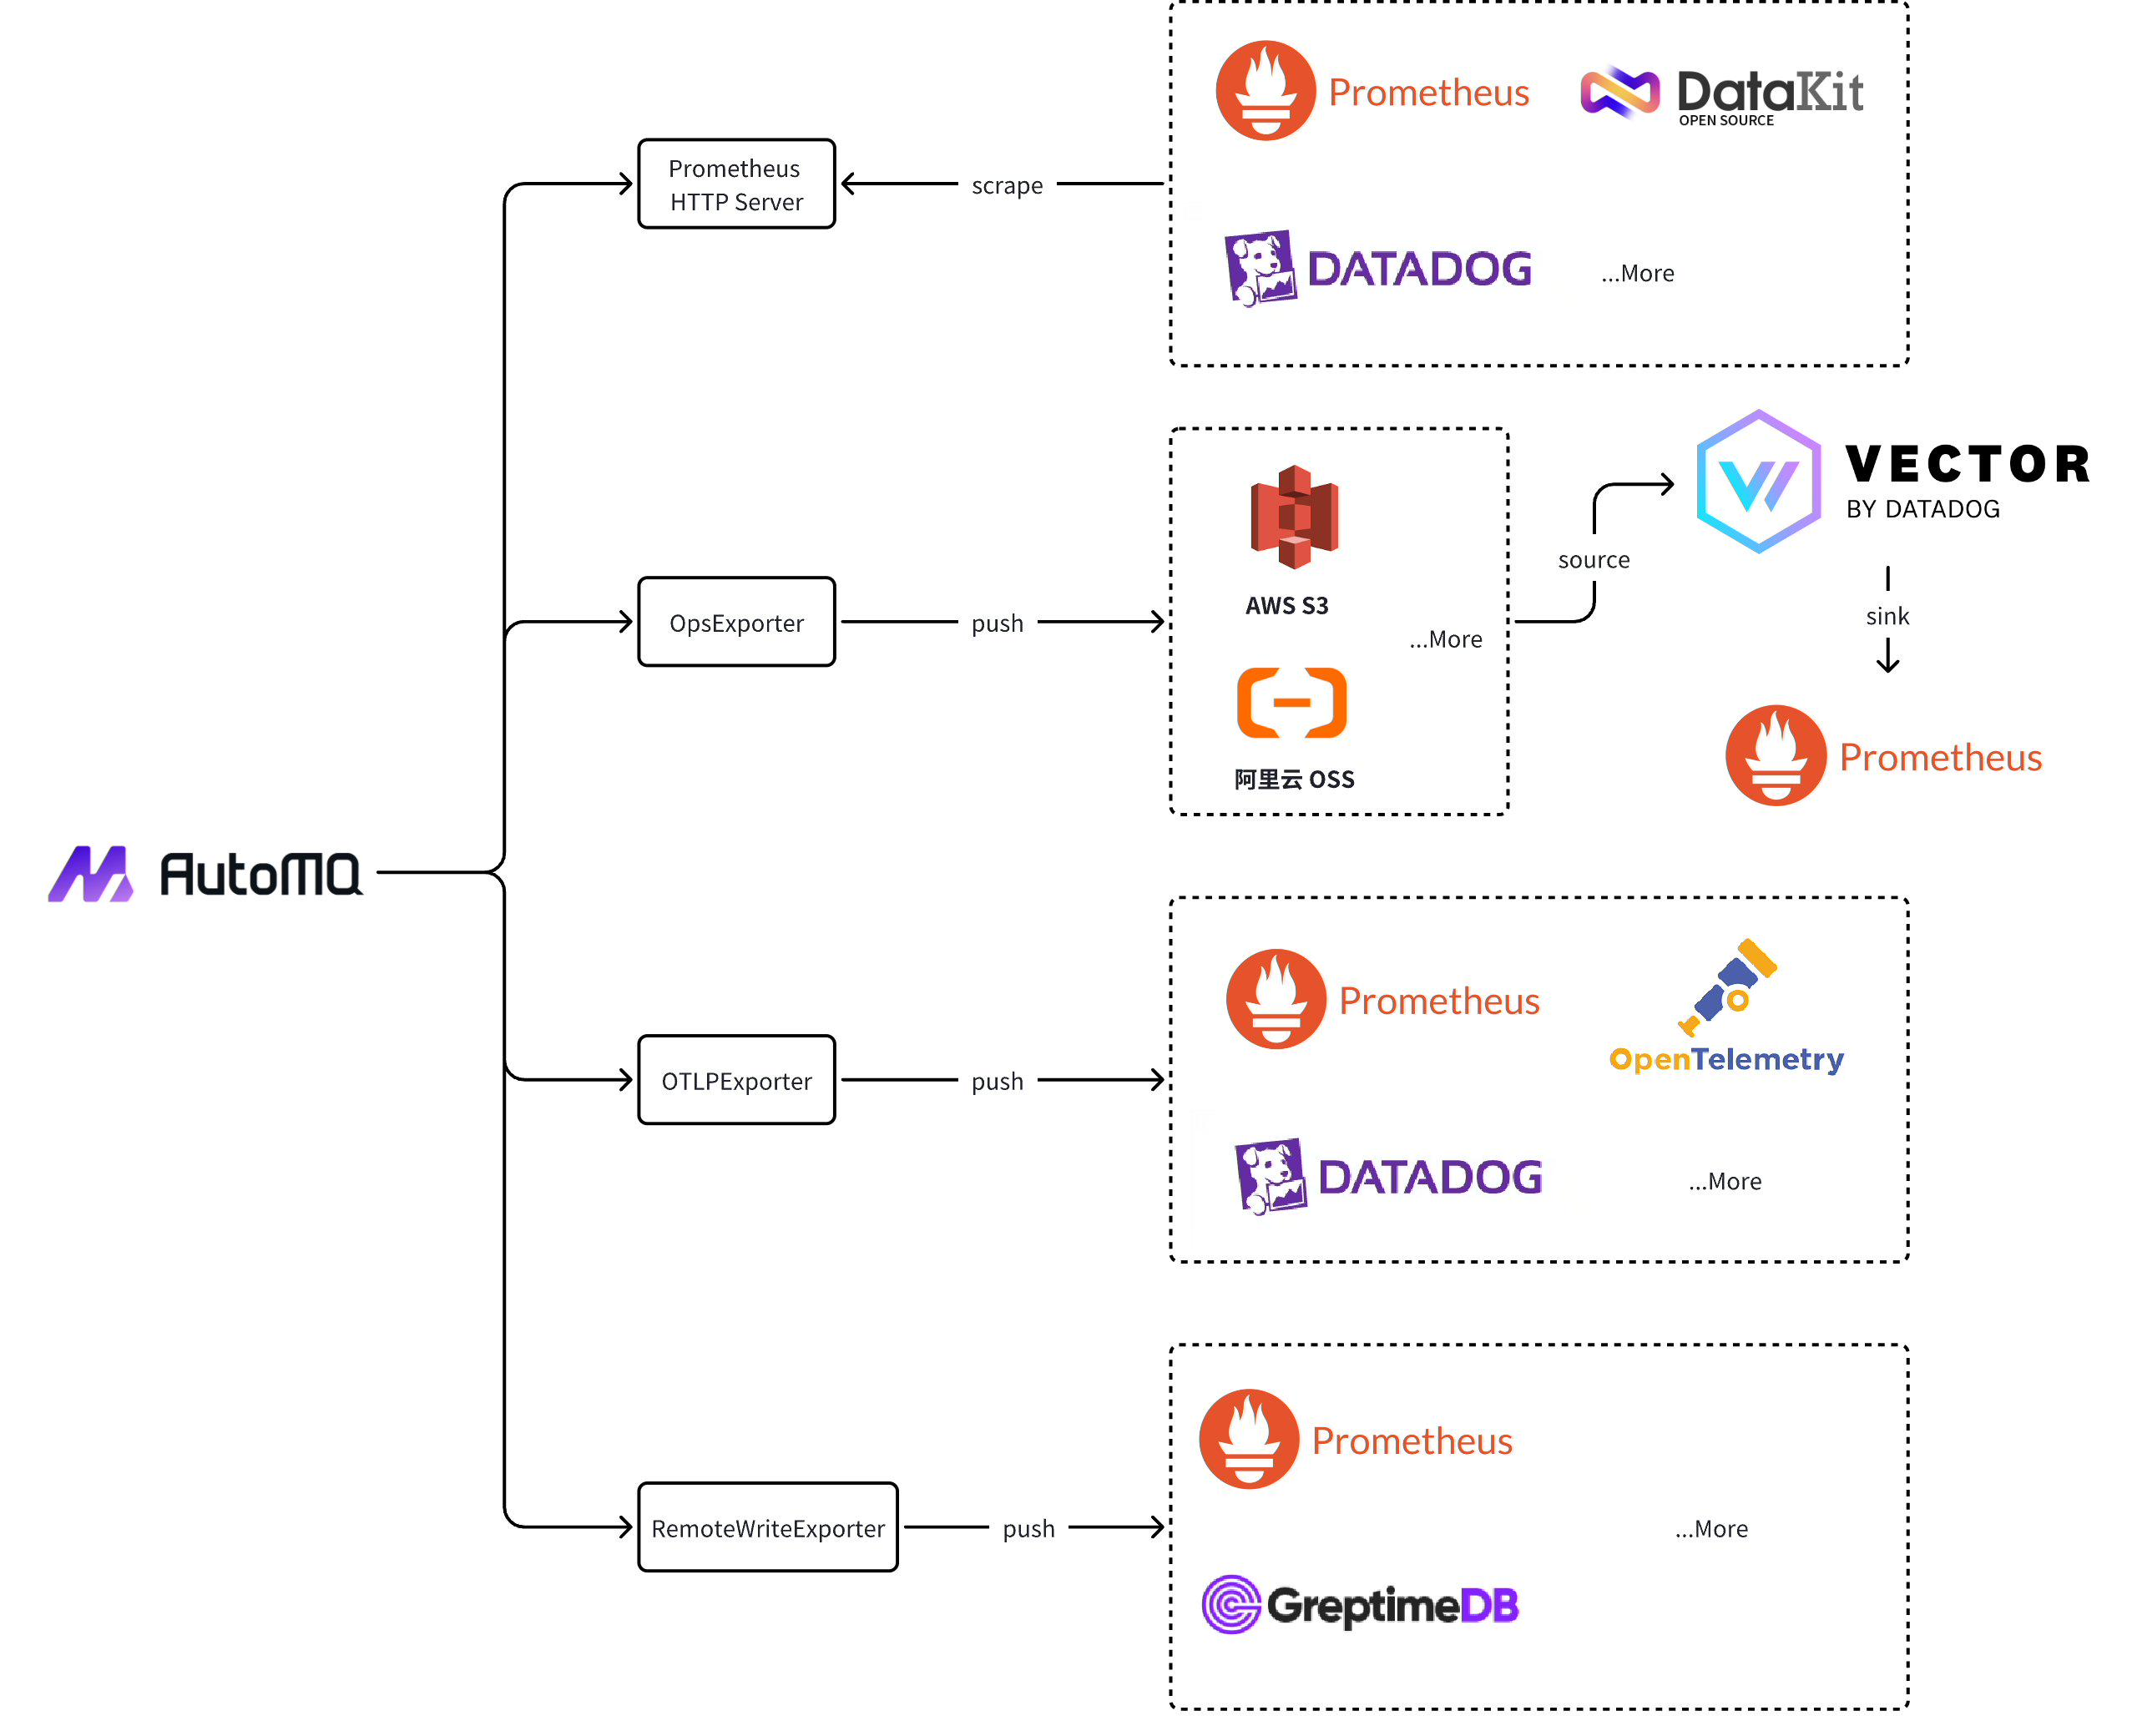
PrometheusMetricsExporter: Implemented using the OTel SDK's PrometheusHttpServer, AutoMQ functions as an HTTP Server exposing a port to provide Prometheus-formatted metrics through a pull-based mechanism.
-
OpsMetricsExporter: An AutoMQ implementation for metrics reporting based on object storage, capable of periodically serializing and uploading collected metrics to a specified object storage bucket, enabling convenient cross-cloud and cross-account metrics sharing and analysis.
-
OTLPMetricsExporter: Implemented using OTel SDK's OtlpHttpMetricExporter and OtlpGrpcMetricExporter, supports pushing OTLP-formatted metrics to external systems via Grpc or HTTP protocols.
-
RemoteWriteExporter: A reporting component provided in the Business Edition of AutoMQ, it supports direct writing to backend storage compatible with the Prometheus Remote Write protocol, allowing integration with most Prometheus-compatible backends without deploying additional components.
Based on the aforementioned export methods, AutoMQ supports integration with the following backend services:
-
Prometheus:
-
Pull-based: Prometheus Server can pull metrics from AutoMQ via static configuration or through custom-built HTTP service discovery and kubernetes_sd.
-
Push-based:
-
You can set up a Vector service to listen to and parse metrics files uploaded to object storage by OpsMetricsExporter, then configure the Vector Prometheus Remote Write Sink to write these metrics into Prometheus Server.
-
Using OTLPMetricsExporter, you can directly write metrics to Prometheus Server supporting OTLP receivers in the OTLP protocol.
-
In the AutoMQ Business Edition, you can also integrate Prometheus Server via the console and write metrics directly using RemoteWriteExporter.
-
-
-
Datadog[6]:
-
Prometheus: The Datadog agent can collect metrics in Prometheus format by configuring the openmetrics_endpoint in the OpenMetrics configuration to the Prometheus HTTP server endpoint exposed by AutoMQ.
-
OTLP: The Datadog agent can enable the OTel receiver by configuring the otlp_config and setting the AutoMQ OTLP endpoint to the corresponding Datadog agent OTel receiver endpoint, allowing for metric export in OTLP format.
-
-
Datakit[7]: As a primary observation component for observability clouds, Datakit can be deployed in agent mode on AutoMQ nodes. By configuring the Prometheus collector, it can scrape metrics and report them to the observability cloud DataWay.
-
Other backends supporting Prometheus protocol: Integrations with other backends like GreptimeDB, VictoriaMetrics, Thanos, and others can be done similarly to the Prometheus method.
AutoMQ provides dashboard templates in the Prometheus format, compatible with Grafana, Cloud Insight, and Nighthawk Monitoring. These dashboards were introduced in previous articles and will not be reiterated here.
AutoMQ version 1.2.x and above offers a unified URI format for monitoring export configurations, as follows:
# <exporter_uri> represents the URI for different types of exporters. You can configure multiple exporters to support various export methods concurrently.
s3.telemetry.metrics.exporter.uri=<exporter_uri1>,<exporter_uri2>,<exporter_uri3>
The configuration methods for different exporter_uri based on protocol are as follows:
- Prometheus HTTP Server:
# hostname: IP or domain name of the HTTP Server
# port: Port number of the HTTP Server
prometheus://?host=$hostname&port=$port
- OTLP:
# endpoint: Access address of the OTLP backend service
# protocol: Use grpc protocol or http protocol
otlp://?endpoint=$endpoint&protocol=$protocol
- S3:
# The object storage reporting method of AutoMQ is enabled by default. You only need to configure the bucket of the object storage. For detailed configuration, please refer to https://github.com/AutoMQ/automq/blob/main/core/src/main/java/kafka/automq/AutoMQConfig.java#L58
s3.ops.buckets=0@s3://$bucket?region=$region
Histogram metrics are primarily used to record statistical data such as avg, p50, p99, etc., and are widely used in AutoMQ to measure various delays, request sizes, queuing times, and more.
In the native metrics of Apache Kafka, Histograms are compiled using a cumulative method, meaning they collect statistical values since the program started. The p50, p99, and other percentiles are calculated using a fixed-length (1024) skip list. This skip list uses the timestamps of recorded data points to compute exponentially decayed weights and expel data points, thereby achieving a recent-time effect for percentiles. Meanwhile, the avg directly exposes the average value since startup, which has limited reference value in real-world online environments. Hence, AutoMQ implements a DeltaHistogram transformation by inheriting MetricsReporter. This transformation converts some of Apache Kafka's native Histogram avg metrics to average values within a fixed time window, allowing these metrics to better reflect the state of the cluster at different times.
For the Histogram metrics added by AutoMQ, we have directly adopted the Delta method for statistics. This means independently calculating metrics like avg, p50, p99, and others in each reporting time window.
During the initial benchmarking of metrics in AutoMQ, we observed that the OTel Histogram type metric generates three types of Metric Names for a single OTel Histogram: $name_bucket, $name_sum, and $name_count. The $name_bucket metric includes a Label "le," which buckets the recorded data points. On the frontend, quantile values can be calculated based on these "le" labels, making the precision of quantile data dependent on the granularity of the bucket divisions. For metrics with a wide range of data, more buckets are needed, resulting in a rapid increase in metric data volume. To address this issue, AutoMQ chose to pre-calculate the corresponding quantile values locally when recording Histogram Deltas. This approach converts the OTel Histogram into a fixed-size Gauge type metric, reducing the data volume by nearly 80% compared to directly using OTel Histograms.
As an independent stream processing platform provider, the business edition of AutoMQ offers integration solutions for the fully managed monitoring services of major Cloud providers. By adding a Remote Write integration through the AutoMQ console and selecting the appropriate authentication method for each provider, you can achieve seamless integration.
-
For Alibaba Cloud Observable Monitoring (Prometheus Edition): Use Basic Auth for authentication and provide the AK/SK credentials of a RAM user with ARMS write permissions on Alibaba Cloud.
-
Tencent Cloud Prometheus monitoring / Huawei Cloud Prometheus: Use Bearer Token authentication and enter the token obtained from the corresponding product console.
-
Amazon Managed Service for Prometheus: Use AWS SigV4 authentication and grant AWS Prometheus write permissions to the corresponding role as prompted by the console.
-
(Coming Soon) Baidu Cloud CProm: Use Bearer Token authentication and enter the token generated by the CProm console and the CProm instance ID.
-
(Coming Soon) Azure Monitor Managed Service for Prometheus: Use AzureAD authentication, complete User-Assigned Managed Identity authorization according to Azure documentation, and enter the ClientId.
This article introduces the observability architecture and integration of AutoMQ from various aspects and discusses specific optimization practices of metrics in conjunction with practical cases of AutoMQ. Finally, the article also covers the integration practices of achieving observability with the Business Edition of AutoMQ in a multi-cloud environment. In the future, AutoMQ will continue to enhance the scalability of its observability architecture and provide more integration methods for observability systems.
[1] How to monitor AutoMQ cluster status using Guance Cloud: https://www.automq.com/zh/blog/monitor-automq-cluster-using-guance-cloud
[2] AutoMQ open-source observability solution: Nightingale Flashcat: https://www.automq.com/zh/blog/automq-open-source-observability-solution-nightingale-flashcat\#%E9%83%A8%E7%BD%B2%E5%A4%9C%E8%8E%BA%E7%9B%91%E6%8E%A7
[3] Metrics Core Library: https://mvnrepository.com/artifact/com.yammer.metrics/metrics-core/2.2.0
[4] jmx_exporter: https://github.com/prometheus/jmx_exporter
[5] What is OpenTelemetry: https://opentelemetry.io/docs/what-is-opentelemetry/
[6] Datadog:https://docs.datadoghq.com/getting_started/
[7] Datakit: https://docs.guance.com/datakit/